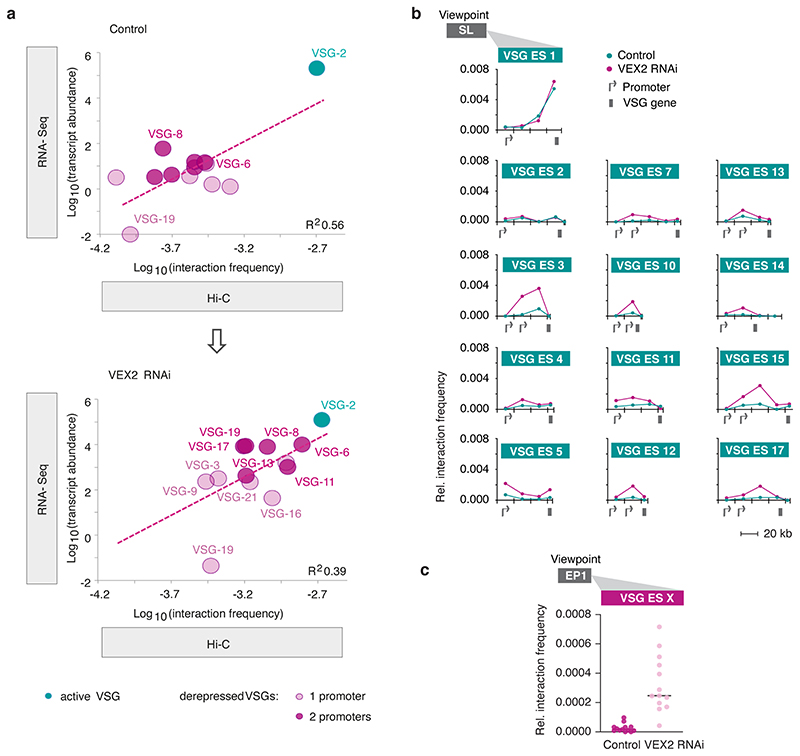
Extended Data Fig. 8. Genome-wide changes in VEX2 depleted cells.
a, Correlation between the average interaction frequency of VSG expression-sites as viewpoint with the SL-RNA locus and VSG expression in reads per kilobase per million (RNA-seq data from 18) in control and VEX2-depleted cells. b, Hi-C (virtual 4C) analysis, viewpoint: SL-RNA locus (chr. 9). Relative interaction frequencies between the viewpoint and VSG expression sites are shown. Bin size 20 kb. The coordinates of all viewpoints used for virtual 4C analyses are listed in Supplementary Information sheet 3. c, Virtual 4C analysis, viewpoint: EP1 gene array (chr.10). Relative interaction frequencies between the viewpoint and the VSG expression sites are shown. Each dot represents the average value for one expression site. Bin size 20 kb.

