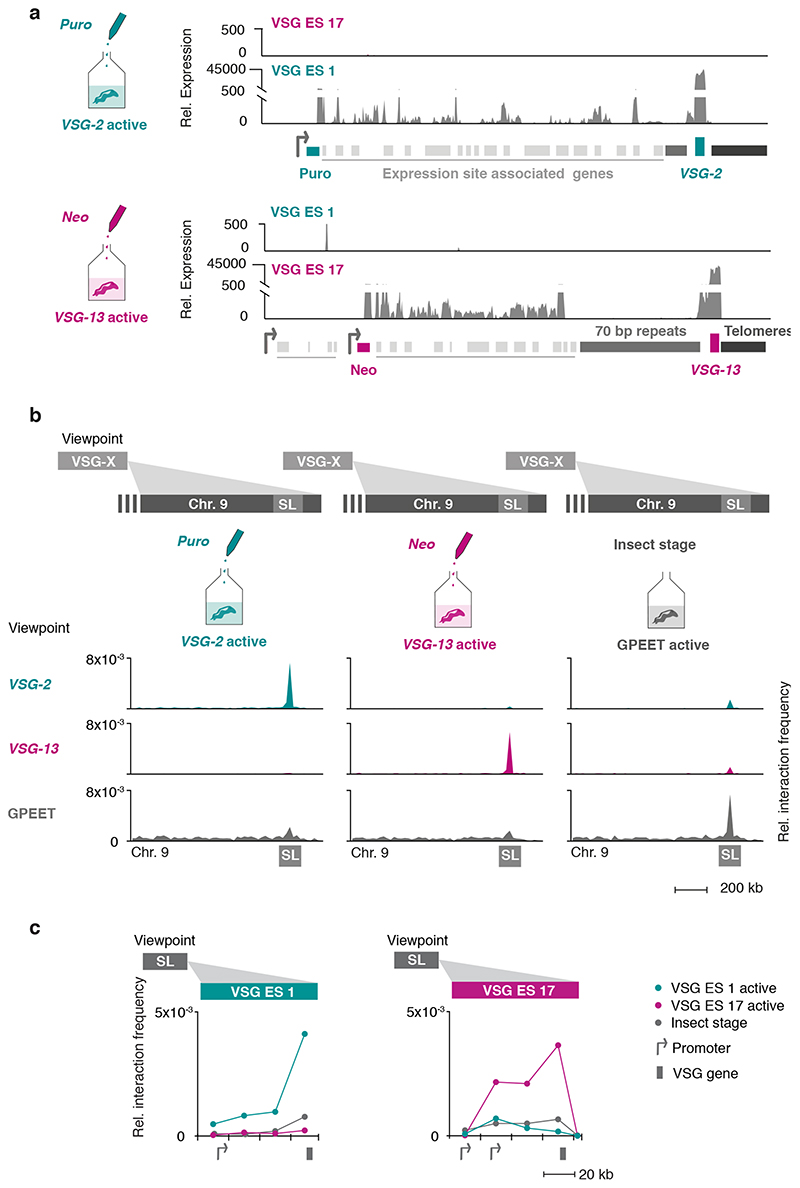
Fig. 2. The interaction between the active VSG gene and the SL-RNA locus is dynamic and changes during a switch in VSG expression.
a, Transcriptome analyses of isogenic cell lines after selection with puromycin (active: VSG-2), top panel, or neomycin (active: VSG-13), bottom panel. For each condition, the average of three biological replicates is plotted. b, Hi-C (virtual 4C) analysis, viewpoints: VSG-2, VSG-13, GPEET gene array (chr. 6). Relative interaction frequencies between the viewpoint and the SL-RNA locus on chr. 9 are plotted. Bin size 20 kb. The coordinates of all viewpoints used for virtual 4C analyses are listed in Supplementary Information sheet 2. c, Hi-C (virtual 4C) analysis, viewpoint: SL-RNA locus (chr. 9). Relative interaction frequencies between the viewpoint and VSG ES 1 or ES 17 are shown. Bin size 20 kb. The analyses in b and c are based on Hi-C experiments with cells expressing VSG-2, VSG-13 or insect stage cells expressing procyclin genes (the average of n=2 biologically independent replicates is shown).

