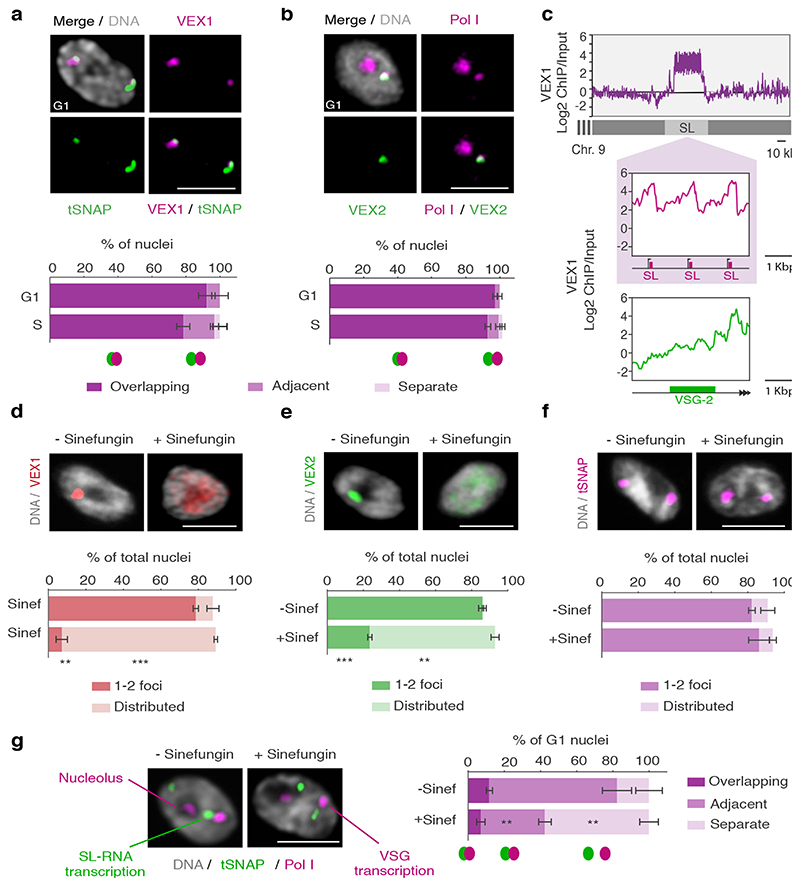
Fig. 3. The VEX complex associates with both the active VSG gene and the Spliced Leader (SL) locus in a splicing-dependent manner.
a-b, Immunofluorescence-based colocalization studies of VEX1myc / tSNAPGFP and GFPVEX2 / Pol I. tSNAP and Pol I are used as markers for the SL-RNA and VSG transcription compartments, respectively. The stacked bar graphs depict proportions of nuclei with overlapping, adjacent or separate signals (these categories were defined by thresholded Pearson’s correlation coefficient – see methods); values are averages of four (a) or two (b) independent experiments (≥100 G1 or S phase nuclei). c, VEX1myc chromatin immunoprecipitation followed by next generation sequencing (ChIP-Seq) analysis. The top graph depicts log2 fold changes of ChIP signal versus input sample across the SL-RNA locus (bin size 300 bp). The inset shows a zoom on three SL repeats (arrows, promoter; magenta boxes, SL-RNA; bin size 10 bp); the bottom plot represents log2 fold enrichment across the active VSG gene (VSG-2, green box, bin size 10 bp). d-f, Immunofluorescence analyses of VEX1myc (d), mycVEX2 (e) and tSNAPmyc (f) before and after sinefungin treatment (5 μg ml-1 for 30 min at 37 °C). Cells displaying no detectable signal (<10%) were excluded. Values are averages of two independent experiments (≥200 nuclei each). g, Immunofluorescence-based colocalization studies of the SL-RNA transcription (tSNAPmyc) and the VSG transcription (Pol I, large subunit) compartments following treatment with sinefungin. The stacked bar graph depicts proportions of G1 nuclei with overlapping, adjacent or separate signals. Values are averages of two independent experiments and two biological replicates (≥100 G1 nuclei). The studies in a-b and d-g were undertaken using super resolution microscopy and the images correspond to maximal 3D projections of stacks of 0.1 μm slices; DNA was counter-stained with DAPI; scale bars 2 μm. In a-b and d-g, a two-tailed paired Student’s t-test was used to compare G1 versus S nuclei and non-treated versus treated nuclei, respectively, for each category; statistical significance is highlighted where applicable: **, p < 0.01; ***, p < 0.001. Experiments in a-b and d-g are representative of at least two independent biological replicates; error bars, SD. Detailed n and p values are provided in Source Data Fig. 3.

