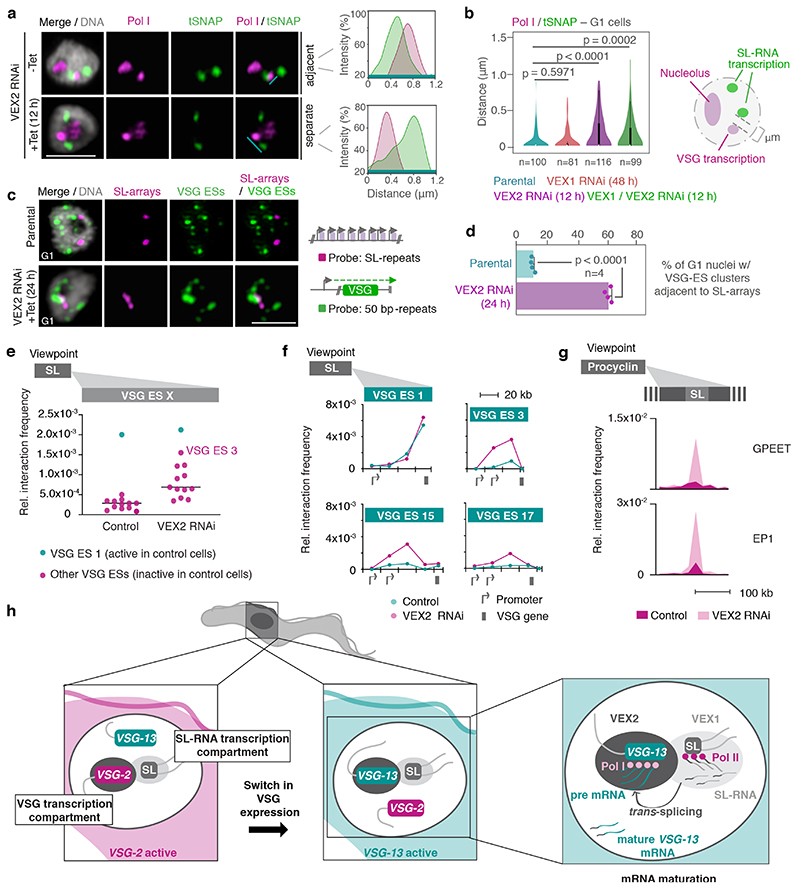
Fig. 4. The exclusive association between the active VSG gene and the SL-locus is VEX2-dependent.
a-b, Immunofluorescence and super resolution microscopy based colocalization studies of tSNAPmyc (SL-RNA transcription compartment) and Pol I (nucleolus and extranucleolar reservoir) following VEX1, VEX2 and VEX1/VEX2 knockdown. On the right-hand side, two representative histograms depict the distribution of signal intensity across the distance indicated by the cyan lines. b, The violin plot depicts the ‘inner’ distance between the Pol I extranucleolar reservoir and the nearest SL-RNA transcription compartment (≥ 81 G1 nuclei) following VEX1, VEX2 and VEX1/VEX2 knockdown. White circles show the medians; box limits indicate the 25th and 75th percentiles as determined by R software; whiskers extend 1.5 times the interquartile range from the 25th and 75th percentiles; polygons represent density estimates of data and extend to extreme values. c-d, DNA fluorescence in situ hybridization (FISH) and super resolution microscopy based colocalization studies of the SL-RNA transcription compartments (probe: digoxigenin labeled SL repeats) and VSG expression sites (probe: biotin-labeled 50 bp repeats) following VEX2 knockdown. The bar graph (d) depicts the % of G1 nuclei with VSG expression site clusters (size > 0.2 μm3) overlapping or adjacent to the SL-arrays (within 60 nm) before and after VEX2 knockdown; error bars, SD. The data are average of two biological replicates and two independent experiments. Representative images in a and c: all nuclei are G1; images correspond to maximal 3D projections of stacks of 0.1 μm slices; DNA was counter-stained with DAPI; scale bars 2 μm; images are representative of two biological replicates and two independent experiments. Statistical analysis was undertaken using a two-tailed unpaired (b) or paired (d) Student’s t-test. Detailed n and p values are provided in Source Data Fig. 4. e, Hi-C (virtual 4C) analysis, viewpoint: SL-RNA locus (chr. 9). Relative interaction frequencies between the viewpoint and the VSG expression sites are shown before and after VEX2 knockdown. Each dot represents the average value for one expression site. Bin size 20 kb. f, Virtual 4C analysis, viewpoint: SL-RNA locus (chr. 9). Relative interaction frequencies between the viewpoint and VSG expression sites is shown. Bin size 20 kb. g, Virtual 4C analysis, viewpoint: EP1 (chr. 10) or GPEET gene array (chr. 6). Relative interaction frequencies between the viewpoint and the SL-RNA locus are plotted. Bin size 20 kb. The analyses in e-g are based on Hi-C experiments with cells before and 24 h after VEX2 knockdown (the average of three biological replicates is shown). The coordinates of all viewpoints used for virtual 4C analyses are listed in Supplementary Information sheet 2. h, Schematic model for monogenic VSG expression. A strong inter-chromosomal interaction between the SL-array and the active VSG gene facilitates spatial integration of transcription and mRNA maturation. VEX1 and VEX2 are primarily SL- and active-VSG associated, respectively, and sustain monogenic VSG expression by excluding other VSGs. The VSG-SL organelle is reconfigured upon activation of a different VSG.

