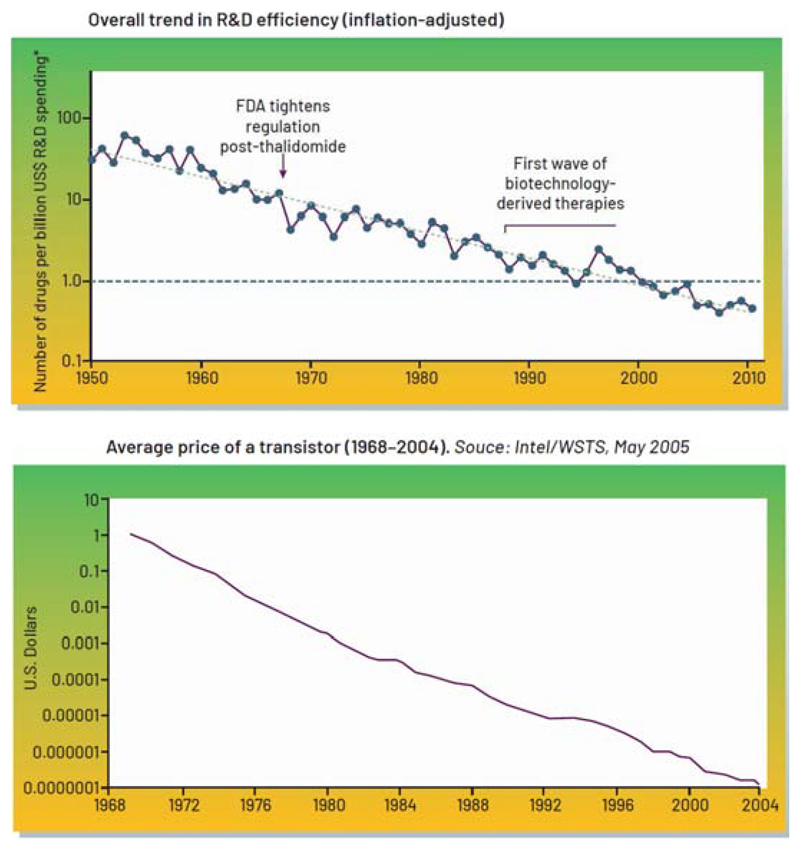
Figure 1.
“Eroom’s” versus Moore’s Law. (Top panel) Inflation-adjusted R&D costs from 1950-2010 pharma R&D efficiency (reproduced with permission from (Scannell et al., 2012). (Lower panel) The decrease in the cost of a transistor over time, following Moore’s projection (Intel/WSTS, 2005(David Brock, 2006)). Note that FDA-related events and biotechnology innovations appear to have a modest impact on the major trend over several decades.

