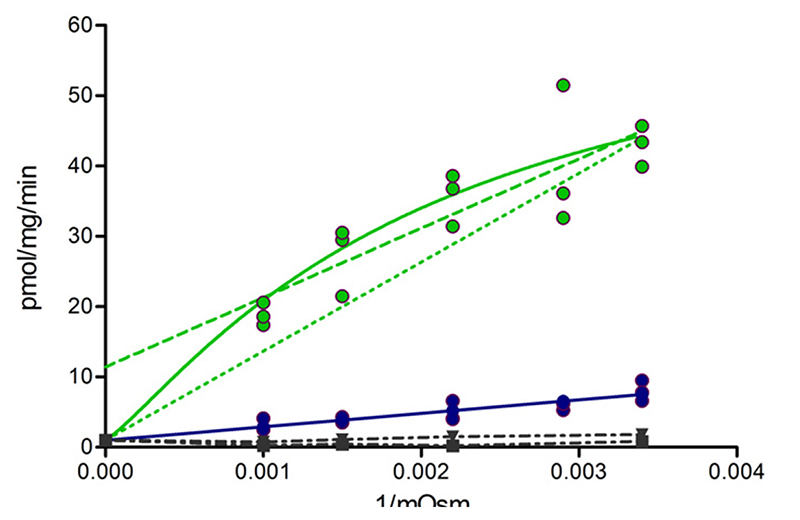
Fig. 10.
ATP-dependent taurocholate transport in wild-type (green) and the M584E/E1244Q mutant (blue) at different osmolarity (Osm). The latter was increased by adding sucrose to the incubation medium. Experimentally determined taurocholate transport rates (filled circles) were plotted as a function of the inverse of the osmolarity. The dashed green line is a linear fit of data points for wild-type BSEP. Solid lines correspond to a nonlinear fit based on the kinetic model shown in Supplemental Fig. 3. If only data points for the five different osmolarities are considered, a significant difference between the two fits (linear versus nonlinear) is not observed. Importantly, an additional constraint has to be taken into consideration. This constraint is defined by the inability of the transporter to accumulate substrate in vesicles with zero inside volume. When considering this constraint, a nonlinear fit (solid green line) performs significantly better than a linear fit (dotted green line, P = 0.0001, extra sum of squares F test). Data points in the absence of ATP are depicted as dot-dashed lines (wild-type: down triangles; M584E/E1244Q mutant: squares). These data points represent the sum of unspecific membrane association of taurocholate and binding to BSEP and define the intersection point of curves obtained by the kinetic model.

