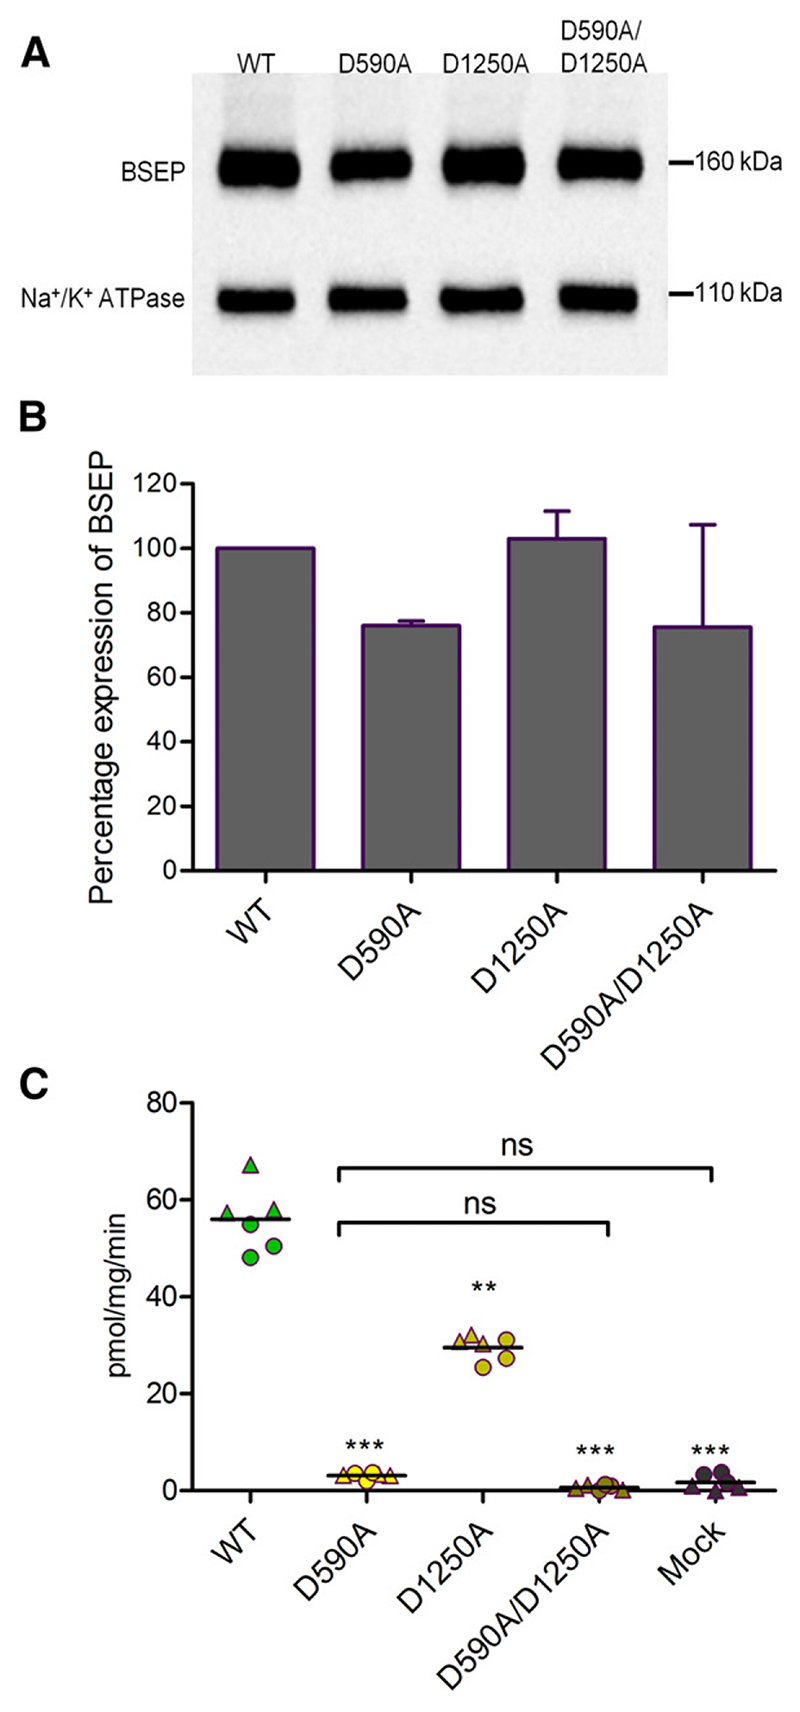
Fig. 6.
(A) Expression of BSEP was evaluated by using the monoclonal BSEP (F-6) antibody. Na+/K+-ATPase was used as a loading control. In (A), a representative Western blot for one experiment is shown. (B) Column graph comparing relative band intensities (mean ± S.D.) of two independent experiments. Expression of wild-type was taken as 100%. (C) ATP-dependent transport of [3H]taurocholate into inside-out membrane vesicles containing wild-type or D-loop mutants is shown. Taurocholate transport was measured, as described in Materials and Methods. BSEP-mediated transport was calculated by subtracting transport in the absence of ATP from that measured in the presence of ATP. Data points conform to triplicates from two independent experiments, which are shown as filled circles and triangles. Horizontal bars indicate mean values. To calculate statistical differences between the groups, averages of individual experiment (n = 2) were subjected to one-way analysis of variance, followed by Tukey’s post hoc test. Statistical significance levels are indicated by asterisks (**P < 0.01; ***P < 0.001). The absence of statistical significance between negative control (mock) and the D590A and the D590A/D1250A mutant is indicated by brackets and ns (not statistically significant).

