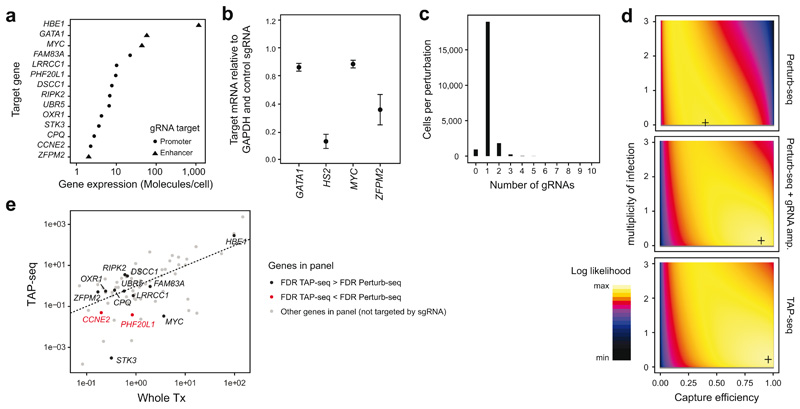
Extended Data Fig. 6. Technical properties of the ground truth perturbation experiment.
a. Gene expression level in K562 cells of the various gRNA target genes used. b. Enhancer gRNAs were validated by pooled transduction of K562 dCas9-KRAB cells with all four enhancer-targeting guides, and the effect on target gene expression was quantified by qPCR. HBE1 was analyzed as target gene for the HS2 enhancer. n=3 replicates. c. Histogram of the number of gRNAs identified per cell in the TAP-seq experiment of Figure 2. d. The number of gRNAs observed per cell (see also in c) was fitted with a generative model of gRNA capture efficiency and multiplicity of infection4,20. Log-likelihood is plotted as a function of the parameters; the maximum likelihood estimate is marked by a cross. Data from n=21,977 (TAP-seq), n=7,994 (Perturb-Seq) or n=37,971 cells (Perturb-seq + gRNA amp.) was used. e. Mean expression per gene for whole transcriptome 10X Genomics compared to TAP-seq, with perturbation target genes highlighted. n=74 genes from panel 2 are shown. Two genes for which perturbation effects were detected with a lower efficiency in TAP-seq are highlighted in red.

