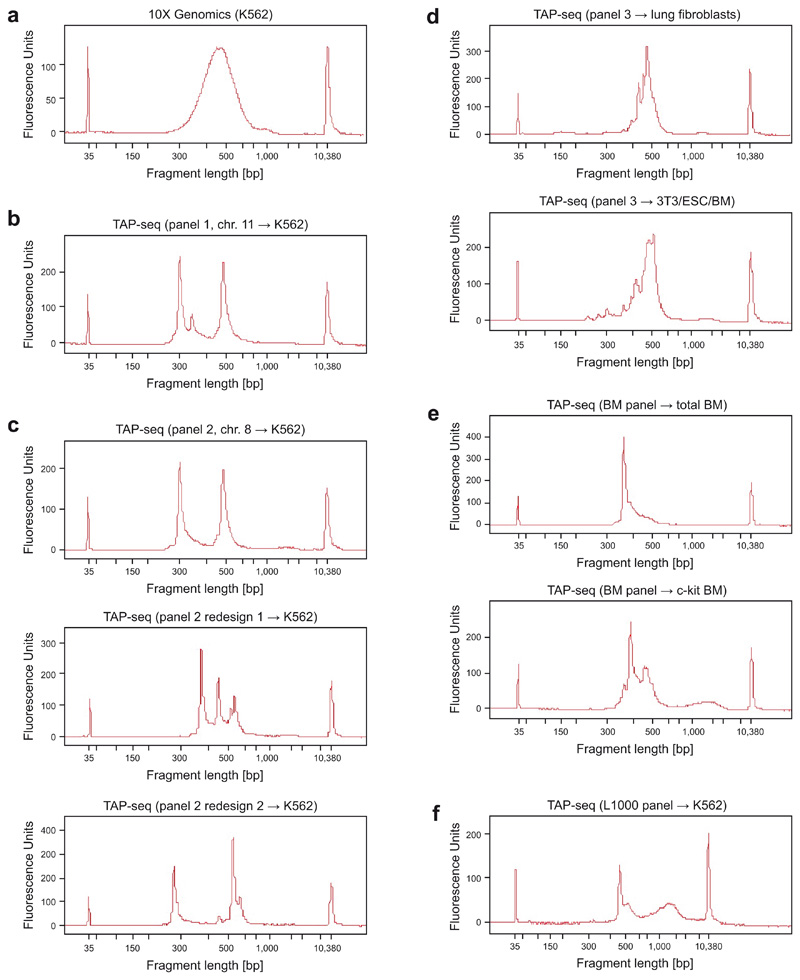
Extended Data Fig. 1. Sample bioanalyzer traces for libraries from TAP-seq and 10X Genomics.
a. Standard 10X Genomics protocol. b. TAP-seq library using panel 1 and cDNA from 10X Genomics K562 cells as input material. Strong peaks in TAP-seq profile correspond to highly expressed genes in the primer panel (HBG1, HBG2, HBE1), as validated by sub-cloning of bands and Sanger sequencing (not shown). c-f. Remaining target gene panels applied to different cell types and cell lines.

