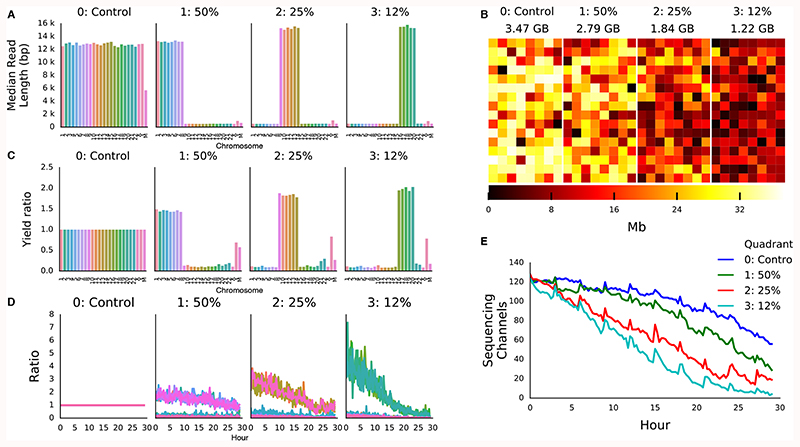
Figure 1. Human Genome Scale Selective Sequencing.
A) Median read lengths for reads sequenced from GM12878 and mapped against HG38 excluding alt chromosomes. The four panels each represent a quadrant of the flow cell. In the control all reads are sequenced, in the second reads mapping to chromosomes 1-8, in the third reads mapping to chromosomes 9-14 and the fourth reads mapping to chromosomes 16-20. The combined length of each of these target sets equates to approximately ½, ¼ and ⅛ of the human genome respectively. B) Heatmap of throughput per channel in each quadrant from the flow cell illustrating reduced yield as the proportion of reads rejected is increased. C) Yield ratio for each chromosome in each condition normalised against yield observed for each chromosome in the control quadrant. D) Yield of on target reads calculated in a rolling window over the course of the sequencing run showing the loss of enrichment potential. E) Plot of the number of channels contributing sequence data over the course of the sequencing run. Channels are lost at a greater rate when more reads are rejected.

