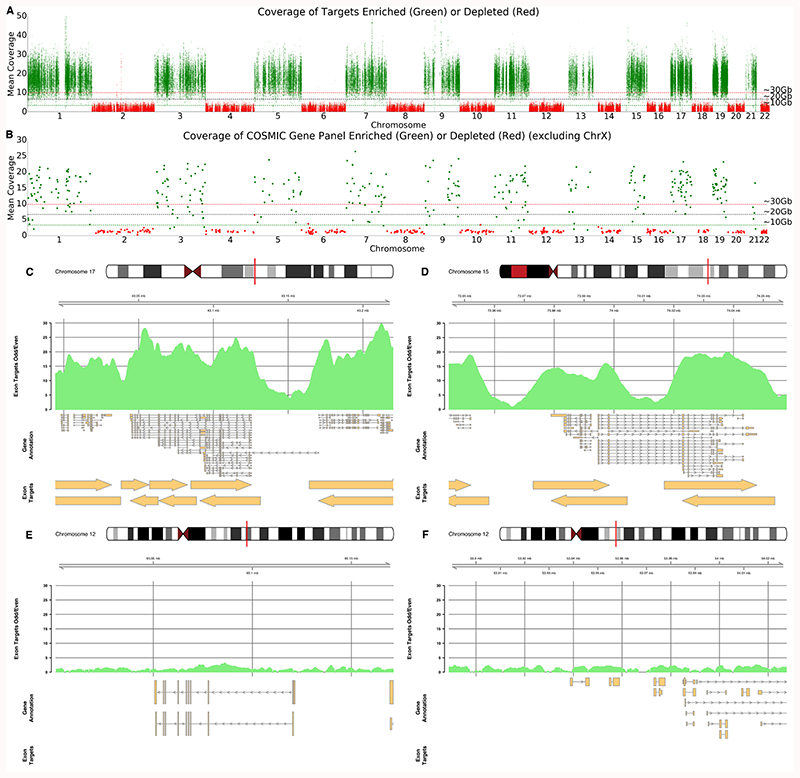
Figure 4. Half Exome Panel Targeted Sequencing.
A) Mean coverage across each exon target in the genome ordered by chromosome. Exons on odd numbered chromosomes are enriched (green) and depleted on even numbered chromosomes (red). B) Mean coverage across each exon for genes within the COSMIC panels. For A and B, horizontal lines represent approximate mean expected coverage for flow cells yielding 10, 20 or 30 Gb of data in a single run. Mean coverage calculated by mosdepth 33. C,D,E,F) Coverage plots for highlighted genes including BRCA1 (C), PML (D), WIF1 (E) and HOXC13 and HOXC11 (F). C and D are enriched as they are found on chromosome 17 and 15 whilst E and F are depleted as genes are on chromosome 12. Exon target regions indicated by arrows. In this experiment, different targets were used for the Watson and Crick strands as illustrated by the offsets. Note the absence of target regions for panels E and F.

