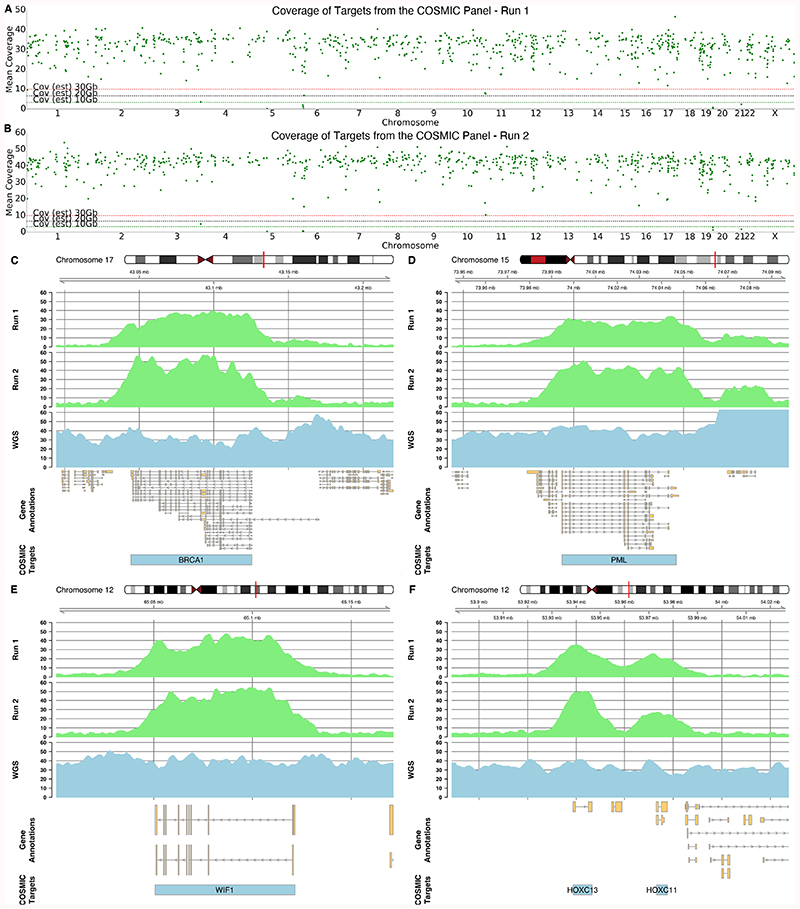
Figure 5. COSMIC Panel Targeted Sequencing.
A & B) Mean coverage across the selected COSMIC gene regions ordered by chromosome for two independent sequencing runs of NA12878. Horizontal lines represent approximate mean expected coverage for flow cells yielding 10, 20 or 30 Gb of data in a single run. Mean coverage calculated by mosdepth 33. C,D,E,F) Coverage plots from each run (light green) for highlighted genes including BRCA1 (C), PML (D), WIF1 (E) and HOXC13 and HOXC11 (F). For comparison, coverage in the same regions for a 35X whole genome sequenced nanopore run shown in blue. COSMIC Target regions indicated by blue bars and include intronic sequence.

