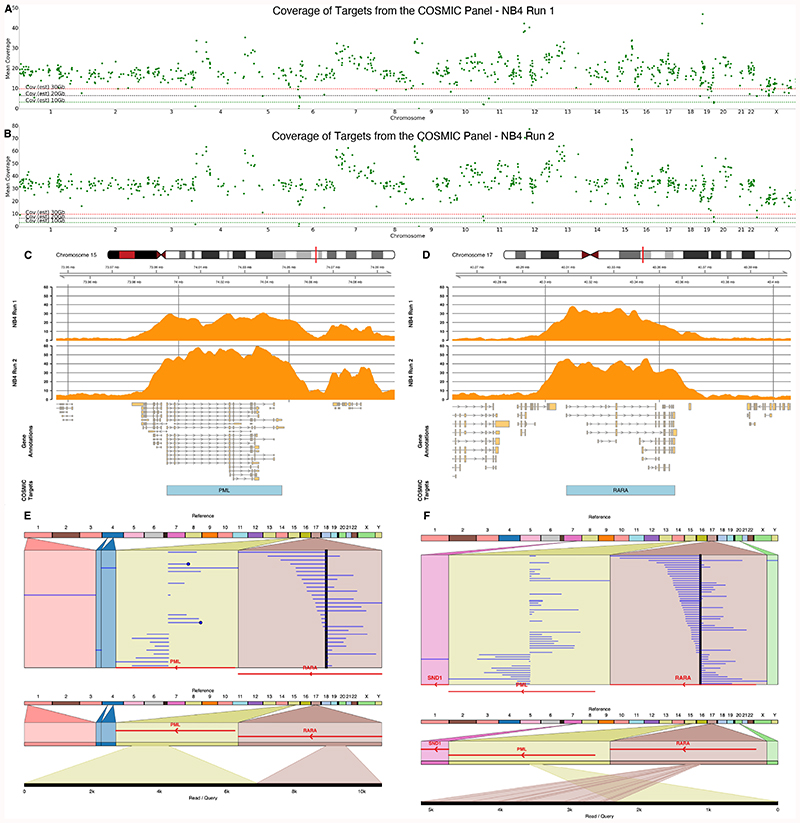
Figure 6. COSMIC Panel Targeted Sequencing of NB4.
A & B) Mean coverage across each of the COSMIC target regions ordered by chromosome for two independent sequencing runs of the NB4 cell line. Horizontal dashed line indicates expected coverage from a flow cell yielding 10, 20 or 30 Gb of sequence data in a single run. C & D) Coverage plots for each NB4 sequencing run shown in orange for PML (C) and RARA (D). E & F) Reads mapping to chromosomes 15 and 17 derived from the NB4 cell line runs 1 and 2 respectively indicating the fusion between PML and RARA. Mappings of example individual reads are shown. Breakpoints identified using svim, visualisations using Ribbon 23,31.

