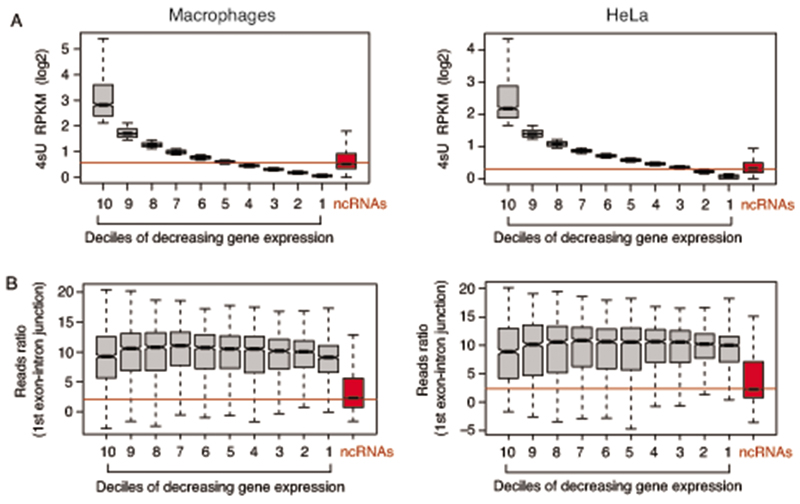
Extended Data Fig. 7. Relationship between gene transcript expression and splicing efficiency.
A) Genes were ranked into deciles of decreasing expression based on 4sU-seq data in macrophages (left) and HeLa cells (right). In both panels, expression of the lncRNAs upregulated in WDR82-depleted cells is shown in the red boxes on the right. Data are from n=3 independent experiments.
B) Splicing efficiency of the 1st exon of the ranked genes was measured by dividing the sequencing reads in the 10nt upstream by those in the 10nt downstream of the 5’ splice junction in polyA RNA-seq data. Left: macrophages (n=6,280 junctions); right: HeLa (n=8,804 junctions). Data are from n=3 independent experiments.
Boxes show values between the first and the third quartile. The lower and upper whisker show the smallest and the highest value, respectively. Outliers are not shown. The notches correspond to ~95% confidence interval for the median.

