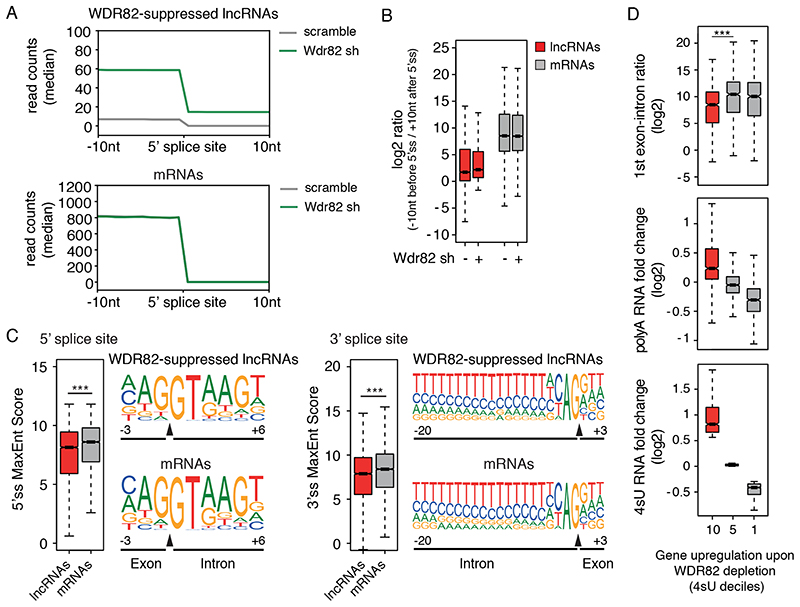
Figure 4. lncRNAs suppressed by ZC3H4-WDR82 contain inefficiently spliced exons.
A) Splicing efficiency at junctions (n=6,280) of WDR82-sensitive lncRNAs (top) and at a randomly selected set of mRNA junctions (n = 6,500) (bottom) in mouse macrophages. A window of +/− 10 nucleotides centered on the 5’ splice sites was used to measure read counts in polyA RNA-seq data.
B) log2-transformed ratio of polyA RNA-seq reads in a window of 20 nucleotides centered on the 5’ splice sites of WDR82-suppressed lncRNA (n=6,280) and of randomly selected set of mRNAs (n = 6,500) with at least one splice junction.
C) Analysis of 5’ (left) and 3’ (right) splice site strength at WDR82-suppressed lncRNAs (n=6,280 junctions) and randomly selected mRNA (n=6,500 junctions). MaxEnt scores were measured as described46. Statistical significance was assessed using the two-tailed Wilcoxon rank sum test in correspondence of both the 5’ (p-value=3.3e-34) and the 3’ (p-value=1.3e-22) splice sites. Nucleotide frequencies at splice sites are shown as sequence logos. Donor and acceptor splice sites are indicated with a black triangle in correspondence of the sequence. *** = p-value < 0.01.
D) Effects of the depletion of WDR82-ZC3H4 on transcription of protein coding genes in mouse macrophages. Expressed protein-coding genes (n=9,466) were divided into deciles based on their sensitivity to the depletion of WDR82 in the 4sU-seq data, with the 10th decile including the most upregulated genes. The log2-transformed RNA fold changes (polyA and 4sU RNA-seq data) and the log2-transformed reads ratio across the first exon-intron junction are shown for the genes (n=946 in each group) in the 10th, 5th and 1st deciles. Statistical significance was assessed using the two-tailed Wilcoxon signed rank test (p-value=4.5e-22). * = p-value < 0.01. Data were from n=3 independent experiments.
For panels B, C and D, the median value for each fold change is shown with a horizontal black line. Boxes show values between the first and the third quartile. The lower and upper whisker show the smallest and the highest value, respectively. Outliers are not shown. The notches correspond to ~95% confidence interval for the median.

