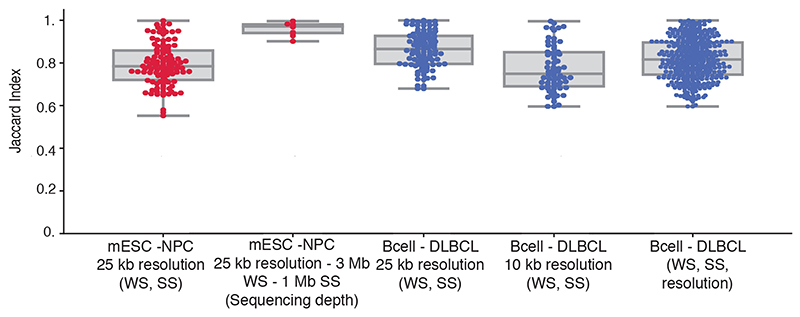
Extended Data Fig. 5. Reproducibility of CHESS using different window (WS) and step sizes (SS), sequencing depths and resolutions.
For this analysis were tested the WS (250 kb - 3 Mb), SS (25 kb - 1 Mb), sequencing depths (percentage of reads between 20 and 80) and resolutions (10 kb and 25 kb) (details in Online Methods). X-axis labels: varied parameters in parentheses, fixed parameters before. The first two boxplots with red dots represent the Jaccard indices (JI) between CHESS results in Bonev et al. 201712 using different WS, SS and sequencing depths. The boxplots with blue dots correspond to the Díaz et al.48 dataset; in this case using different WS, SS, and then between different WS, SS and resolutions. mESC mouse embryonic stem cells, NPC neural progenitor cells. Boxplot elements: centre line: median, whiskers: 1.5x interquartile range, box limits: upper-lower quartile.

