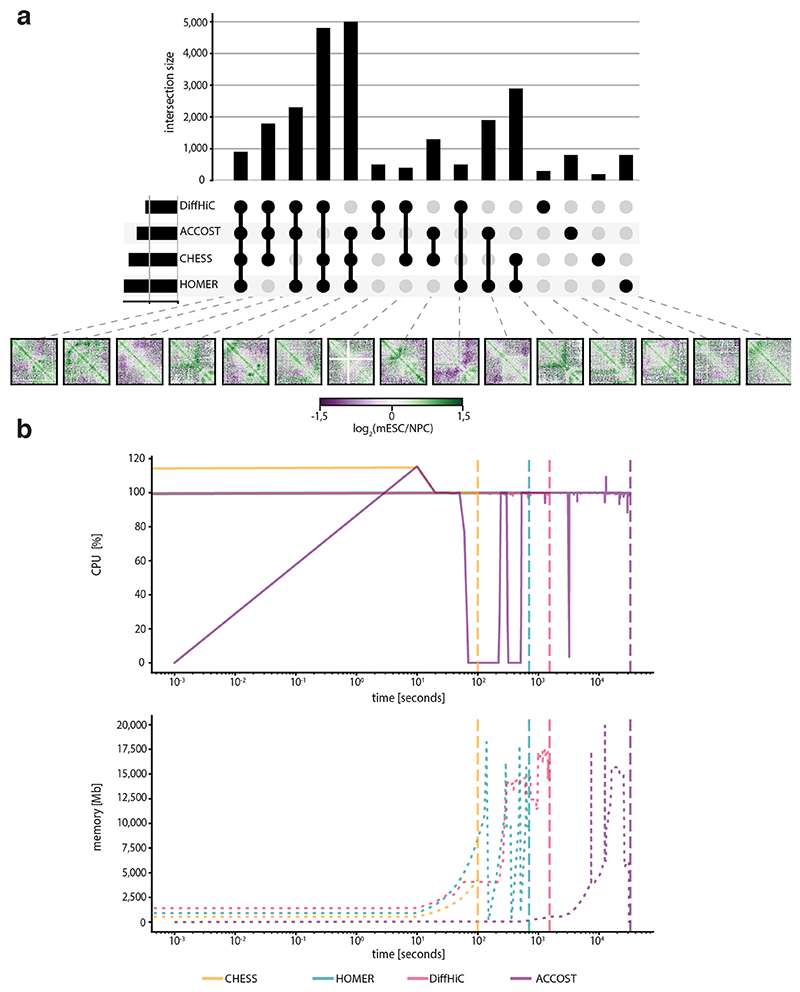
Extended Data Fig. 6. CHESS benchmark against HOMER, diffHiC and ACCOST.
a, Upset plot representing the intersection size between differential interactions of CHESS, HOMER, diffHiC and ACCOST. Below, an example is shown for each intersected group. b, Computational requirements of CHESS, HOMER, diffHiC and ACCOST. The first line plot shows the CPU usage, the second the memory consumption. The vertical dashed line represents the end of the run.

