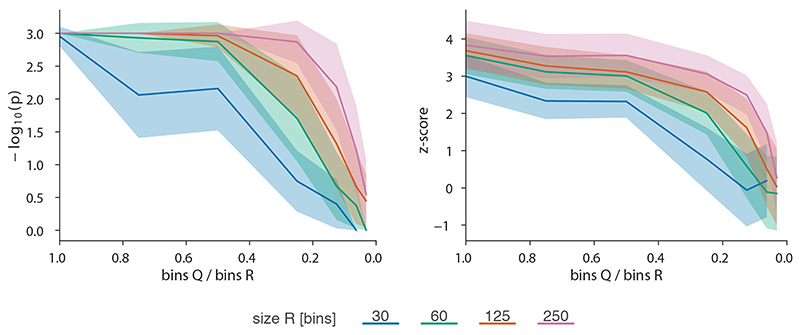
Extended Data Fig. 7. CHESS performance on differently sized simulated matrices with realistic noise and sequencing depth.
Shown are empirically determined CHESS p- and z-scores (details in Online Methods) for comparisons of R with a read depth of 100 read pairs / 100 bins and a resized copy Q. Scaling factor is indicated on the x-axis. A noise level of 25 % was added to both matrices independently. Sequencing depth was adjusted to 100 k/Mb. Solid lines indicate the mean, shaded areas the standard deviation over 100 simulations per parameter combination. Colours correspond to the different sizes of R.

