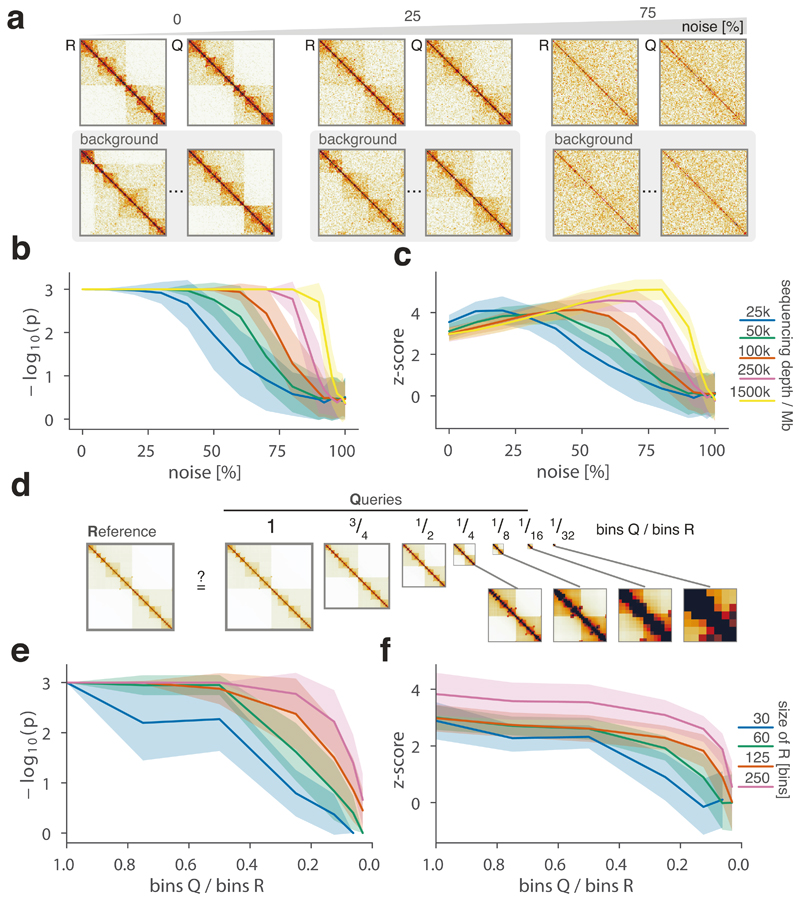
Figure 2. CHESS evaluation on synthetic Hi-C matrices.
a-c, Tests for the tolerance of CHESS to increasing levels of simulated experimental noise. a, Schematic representation of the tests for the sensitivity of CHESS to noise. b, Empirically determined CHESS P values on synthetic matrices with increasing levels of noise (details in Online Methods). c, CHESS z-scores on synthetic matrices with increasing levels of noise. d-e, Tests for the performance of CHESS when comparing matrices of different sizes. d, Schematic representation of different scaling factors used to generate a query matrix Q from a reference R. e, Dependence of CHESS P values on the scaling factor of synthetic matrices Q and R. f, Dependence of CHESS z-scores on the scaling factor. b, c and e, f, Solid lines indicate the mean, shaded areas the standard deviation over 100 simulations per parameter combination. Lowest possible P value in all tests: 0.001.

