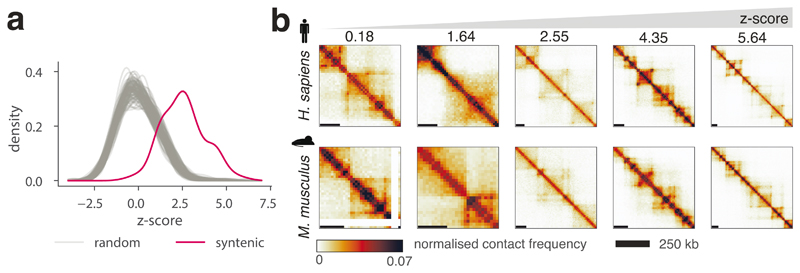
Figure 3. Global comparison of syntenic region similarity between human and mouse using CHESS.
a, Distributions of empirically determined CHESS z-scores for 175 syntenic region pairs in human and mouse (red) and 100 random permutations of region pairs (grey) (details in Online Methods). One sided randomization test P value = 0.01, comparing the mean scores of randomly permuted pairs to the mean score of real syntenic regions. b, Examples of syntenic regions with increasing CHESS z-scores from left to right.

