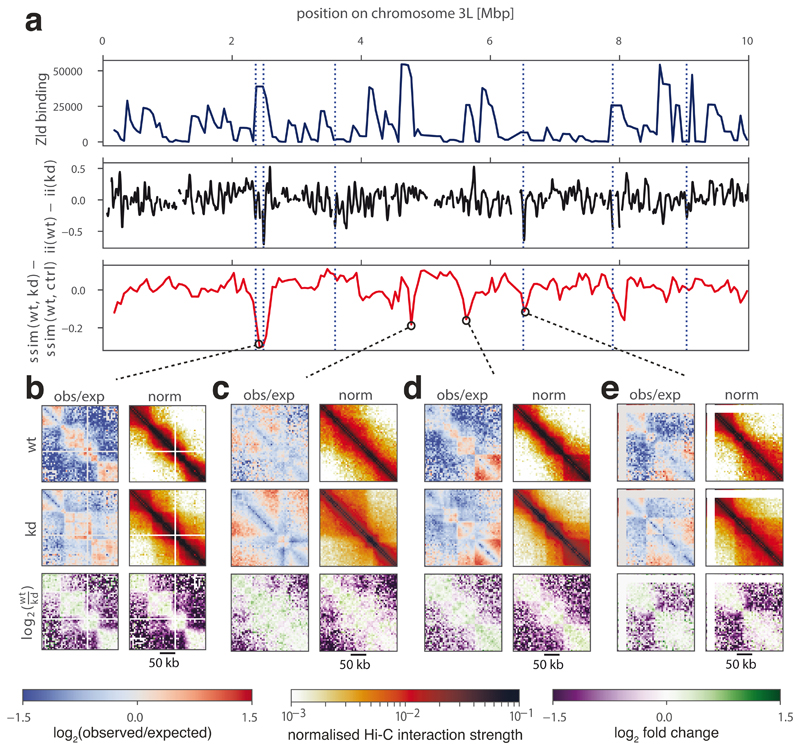
Figure 4. Identification of chromatin conformational changes in fly embryos after Zelda (zld) knockdown.
a, Zelda binding signal in wild type (wt) (top), insulation score difference between wt and zld knockdown (kd) (middle, smoothed), and difference between similarity scores calculated on wt to kd and wt to water injection control (ctrl) (bottom) for regions on a subset of chromosome 3L. Dotted blue lines indicate differential boundaries as identified by 9. b-e, Examples of regions with the strongest conformational changes between wt and kd, showing observed/expected (obs/exp) and normalized Hi-C matrices, and log2-fold-change matrices for wt/kd. White lines on the Hi-C plots correspond to regions of the genome masked from the analysis due to low mappability.

