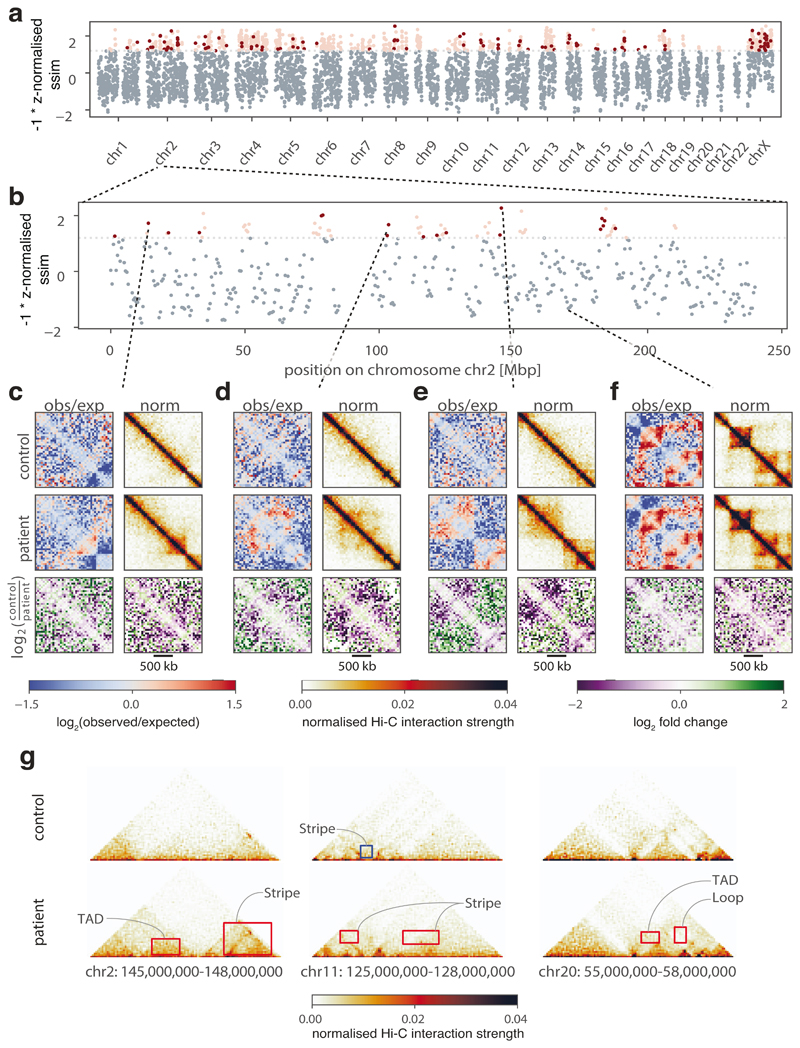
Figure 5. Identification of structural changes in a diffuse large B-cell lymphoma.
a, b Similarity (z-normalized similarity score) of Hi-C data generated from healthy B-cells (control) and a diffuse large B-cell lymphoma (patient), as assessed by CHESS for 2-Mb regions. Highly dissimilar regions (z-normalized similarity score ≤ -1.2) are colored in red, where noisy regions (signal to noise ratio < 0.6) are in light red. c-f, Examples of regions with conformational changes (c-e) and conservation (f) between healthy and diseased B-cells, showing observed/expected (obs/exp) and normalized Hi-C matrices, and log2-fold-change matrices for control/patient. g, Three examples of highly dissimilar regions identified by CHESS, with the gained and lost features highlighted in red and blue, respectively. The features are annotated according to their structural category.

