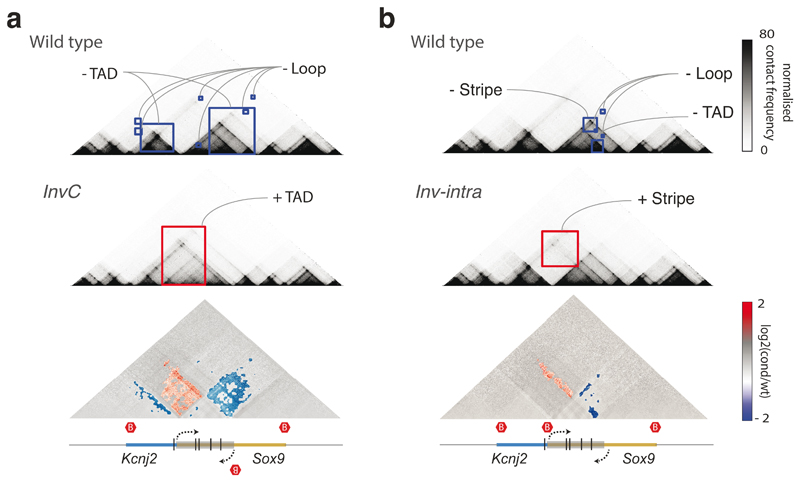
Figure 6. Feature extraction from Capture-C data from Despang et al.50 .
a, Feature extraction of wt against InvC mutant maps, which present an inversion in the Sox9 sequence represented by a grey box (bottom). Lost and gained structures in the mutant are highlighted in blue and red squares, respectively. The bottom plot shows a log2 fold-change map with identified features colored according to the directionality of the change. Red hexagons demarcate the positions of TAD boundaries. b, Same as a, for feature extraction of wt against Inv-intra mutant maps, in which the same sequence is inverted, not including the border between the two TADs.

