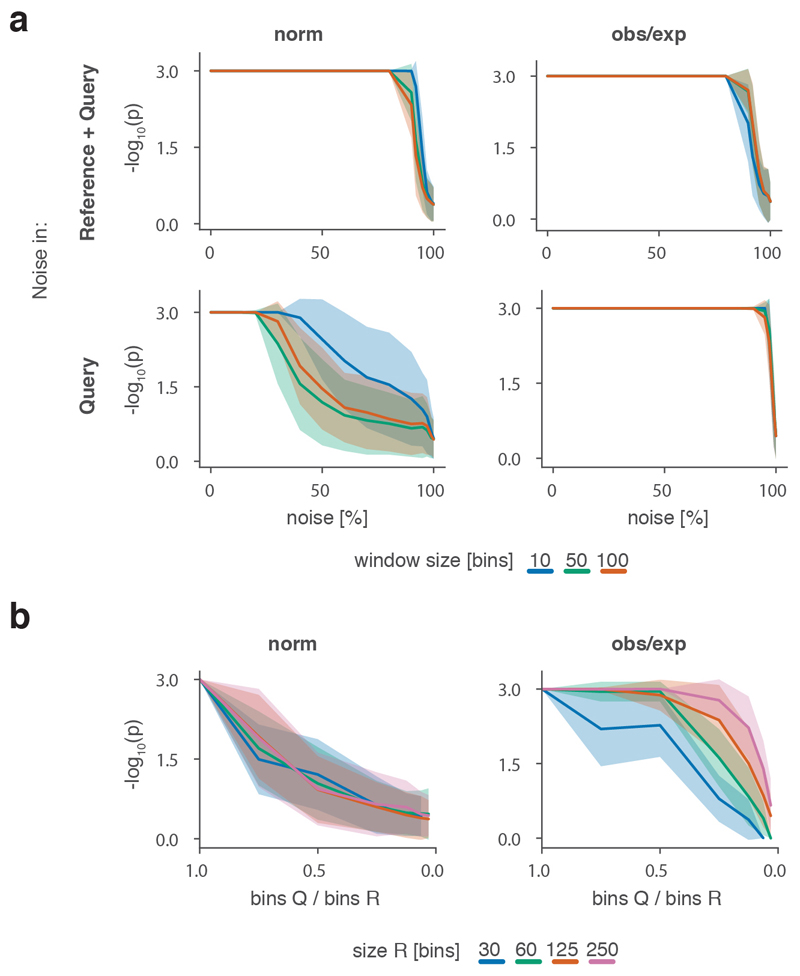
Extended Data Fig. 1. Performance analysis of the CHESS algorithm.
a, CHESS p-values in dependence of the relative noise level in synthetic matrices. Shown are the cases of equal amounts of noise in reference R and query Q (top) and different amounts of noise (bottom, noise only added to Q). Each case is examined for normalised and observed/expected (obs/exp) matrices, and different window sizes in the SSIM algorithm. b, Empirically determined CHESS p-values in dependence of the size factor between R and Q for normalised (left) and observed/expected (obs/exp) matrices (right) (details in Online Methods). a, b, Solid lines indicate the mean, shaded areas the standard deviation over 100 simulations per parameter combination.

