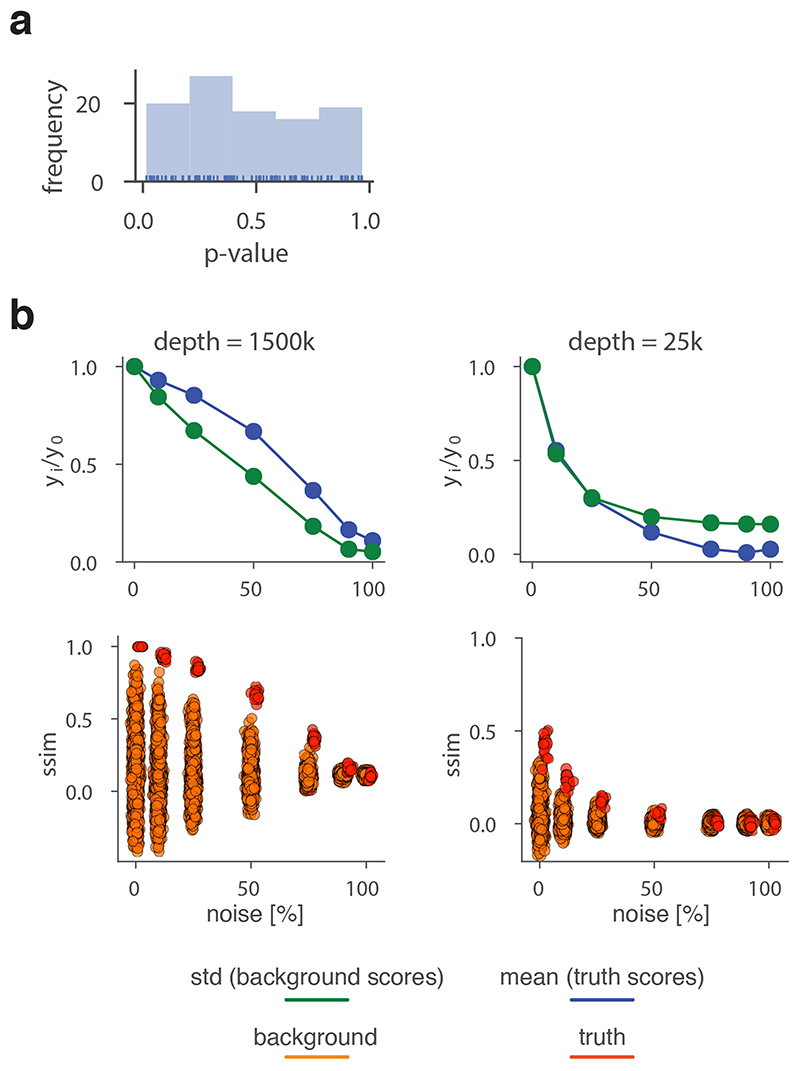
Extended Data Fig. 3. Additional analysis of the CHESS algorithm.
a, Uniform distribution of empirically determined CHESS p-values for comparisons of matrices with 100 % noise added. b, Distribution of structural similarity scores (ssim) for background and truth comparisons at 25 k/Mb and 1.5 M/Mb simulated sequencing depth. Above each: Fractional change (value at x % noise/value at 0 % noise) of the standard deviation (std) of background scores and mean of truth scores over 100 simulations per parameter combination.

