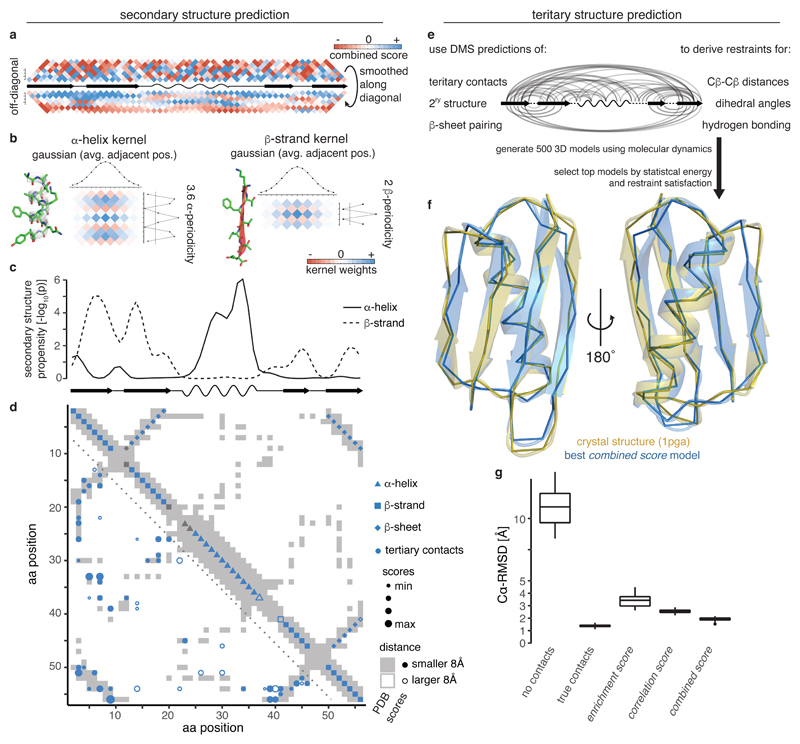
Fig. 3. Secondary and tertiary structure prediction from deep mutational scanning data.
a, Local interactions (above diagonal – raw combined scores up to 7 aa distance in linear sequence, below diagonal – scores smoothed with Gaussian kernel) reveal signatures of secondary structure. Middle line is diagonal of interaction score map (rotated by 45 degrees) and shows secondary structure elements of reference structure.
b, 2D kernels with sinusoidal profile to detect stereotypical alpha helical (left, period of 3.6) and beta strand (right, period of 2) interactions and perpendicular Gaussian profile to average over similar interaction patterns in adjacent positions.
c, Secondary structure propensity p-values derived from kernel smoothing (one-sided permutation test, see Methods) in comparison to reference structure secondary structures (wave – alpha helix, arrow – beta strand).
d, Structural predictions derived from combined score data compared to reference structure contact map (grey shading). Lower left: Top 55 non-local (>5 aa in linear sequence) tertiary contacts. Upper right: Predicted secondary structure elements. Fill indicates correct prediction. Beta strand predictions are derived by intersection of beta strand propensities (panel c) and beta sheet pairing predictions (Supplementary Fig. 3b,c).
e, Scheme for generation of 3D structural models (see Methods for details).
f, Overlay of top structural model of protein G B1 domain generated with restraints from combined score (blue) and crystal structure (gold, PDB entry 1pga).
g, Accuracy (Cα root-mean-square deviation) of top 5% structural models (n = 25) generated from interaction score-derived restraints (three right-most columns) compared to reference structure. Left: ‘No contacts’ – negative control with restraints only for secondary structure (predicted by PSIPRED)62. ‘True contacts’ – positive control with restraints derived from 55 random tertiary contacts, secondary structure elements and beta sheet interactions of the reference structure. Boxplots: boxes cover 1st to 3rd quartile of the data, with middle bar indicating median, whiskers extend at maximum to 1.5-times the inter-quartile range away from the box.

