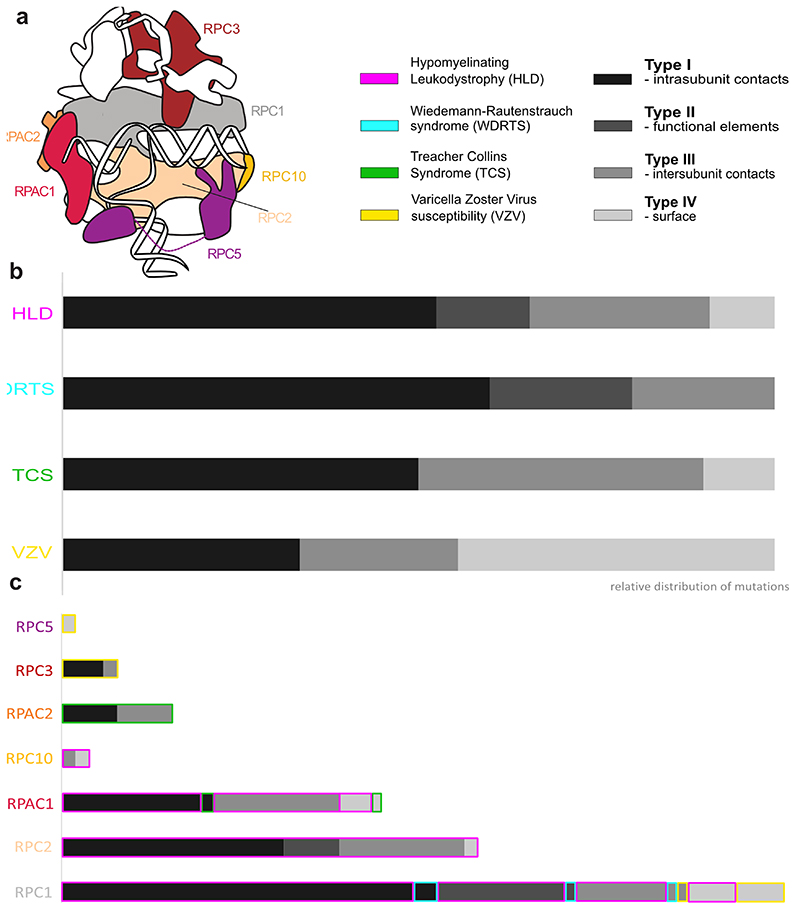
Extended Data Fig. 10. Outlined types of point mutations in Pol III correlate with diseases.
a, Cartoon representation of Pol III showing affected subunits (in colour). Diseases correlated with mutations and types they have been assigned to. b, Relative distribution of types of mutations in each considered disease. c, Relative distribution of types of mutations in each subunit. Coloured outlines reference diseases. Size of bars corresponds to the number of mutations within each subunit. For the type assignment, see Methods. For details of individual mutations, see Supplementary Table 2.

