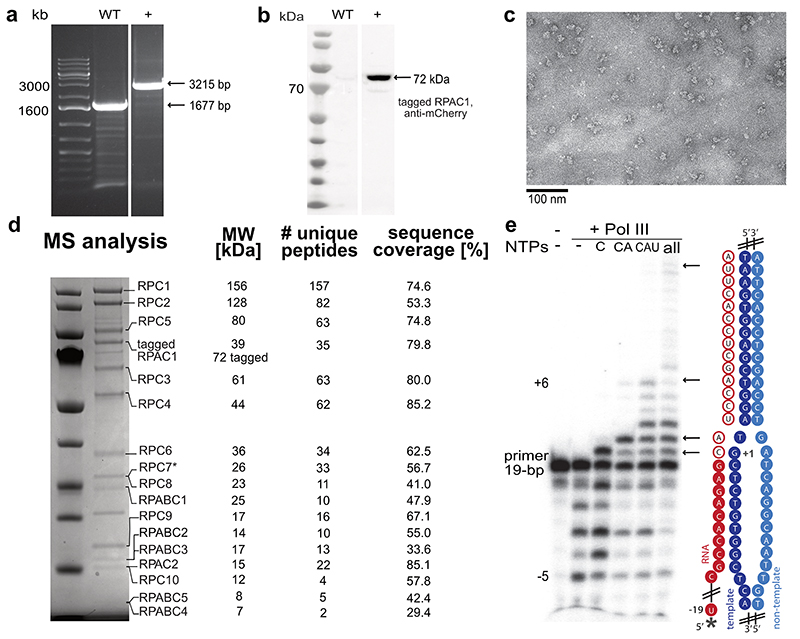
Extended Data Fig. 1. Endogenous tagging of RPAC1 and analysis of purified Pol III.
Zygosity PCR with purified genomic DNA from WT cells HEK293T and produced RPAC1-Strep II-mCherry tagged cell line. The experiment was performed twice. b, Western blot of cell lysates from WT cells and positive for the insert cell line probed with anti-mCherry antibody (Abcam). The experiment was performed once. c, Representative negative stain micrograph showing homogenous sample. d, Coomassie-stained SDS-PAGE of purified Pol III complex. Identities of the labelled bands were confirmed by mass spectrometry with the highest scoring hit shown. For RPC7 (starred) the α isoform was detected as most abundant, while β isoform was also present in the sample. e, Primer extension assay confirming the activity of the purified complex. 5’ radioactively tagged RNA primer (starred) assembled with the DNA scaffold (cartoon representation) was used. Arrows indicate the extended primer products. For experimental details, see Methods. Uncropped images for all panels are shown in the Source Data.

