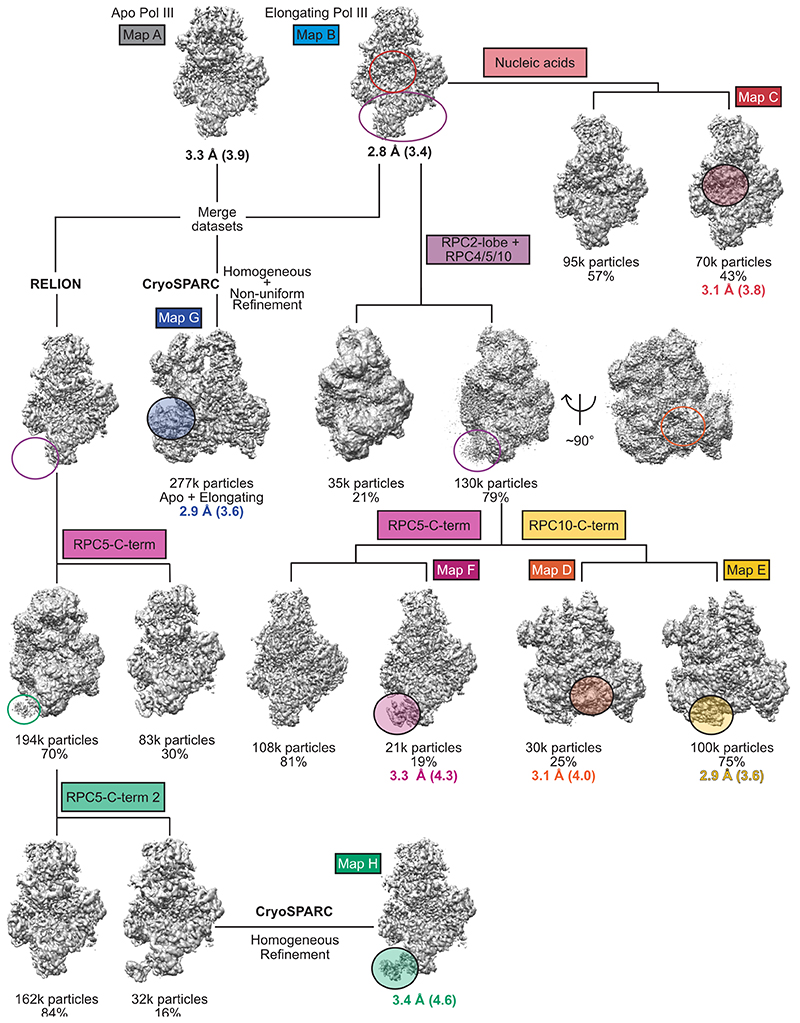
Extended Data Fig. 3. Refined cryo-EM data processing strategy to improve signals of flexible regions.
Conformation heterogeneity was resolved using masked classification in RELION. Coloured unfilled circles mark regions with applied masks. Filled, transparent circles highlight elements with improved cryo-EM density. Threshold levels of the shown maps were individually adjusted to visualise flexible elements. Maps labelled with coloured boxes were used for structural model building. Map G and H derived from a merged dataset of apo and elongating human Pol III. Both RELION68 and CryoSPARC69 were used for data processing, as indicated.

