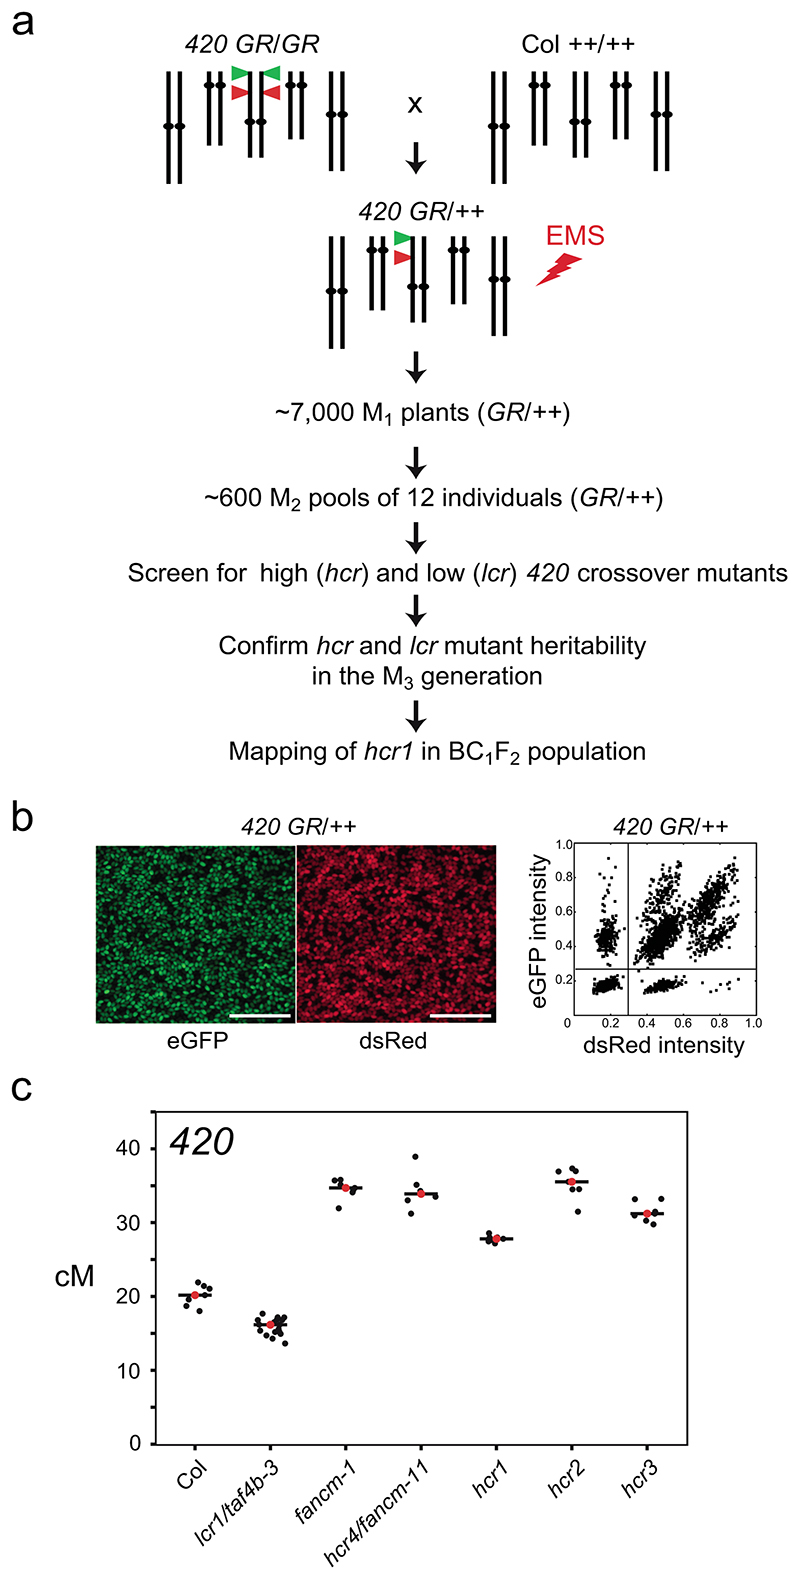
Figure 1. A forward genetic screen for mutants with changed 420 crossover frequency.
a, Schematic diagram of a forward genetic screen for identifying high (hcr) or low (lcr) crossover mutants, using the 420 FTL crossover reporter interval (green and red triangles on chromosome 3). 420/++ seed were EMS treated and the subsequent steps followed to identify the hcr1 mutant. b, Representative fluorescent micrographs of 420/++ seeds. Scale bars=5 mm. A representative plot of red (dsRed) and green (eGFP) fluorescence values from 420/++ seed is shown alongside. Vertical and horizontal lines indicate thresholds for colour:non-colour classifications used for crossover frequency estimation. c, 420 crossover frequency (cM) in wild type, fancm, hcr and lcr mutants. Mean values are indicated by red dots and the black horizontal bar.

