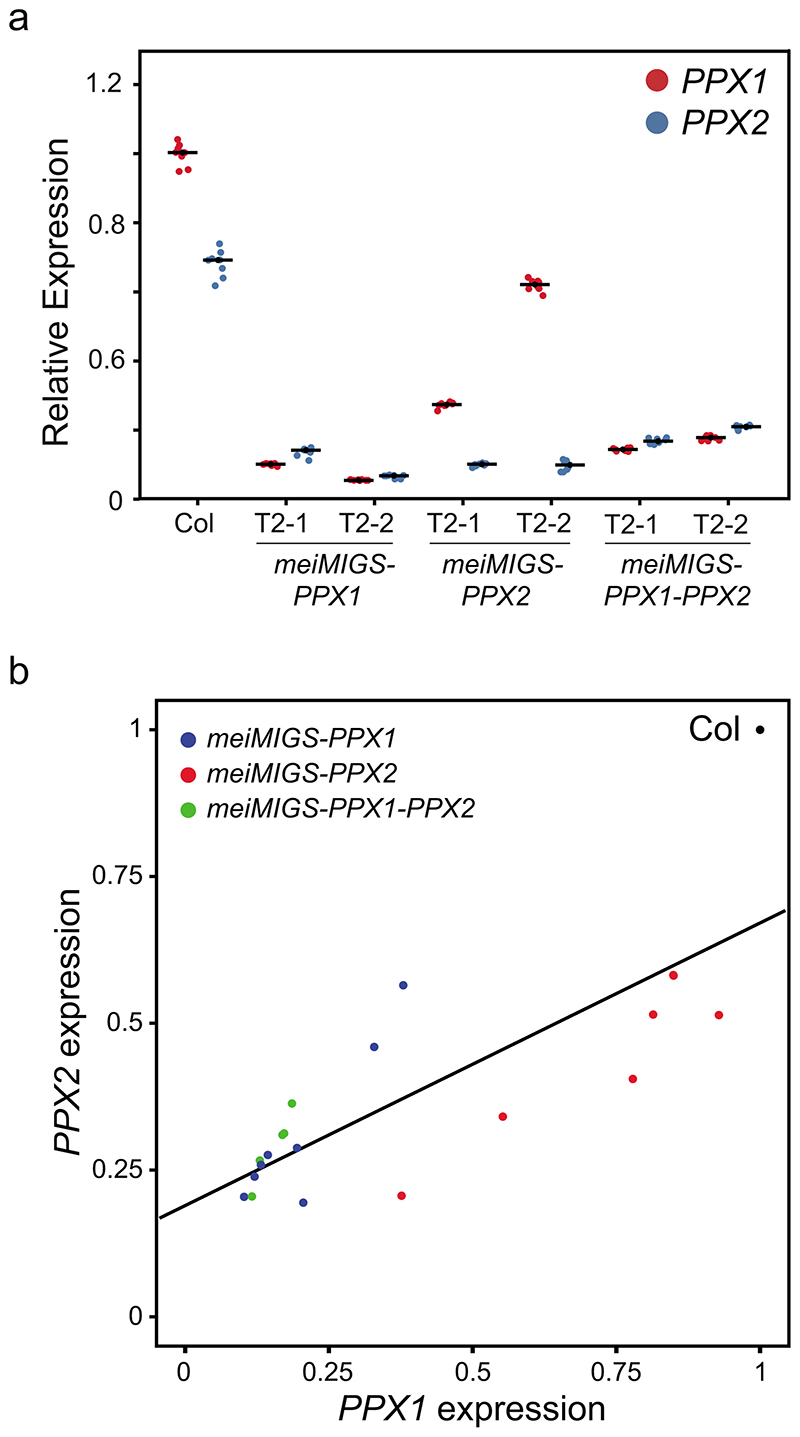
Extended Data Fig. 5. Meiosis-specific knockdown of PPX1 and PPX2 in meiMIGS transgenic plants.
a, qRT-PCR analysis of PPX1/HCR1 and PPX2 transcripts in floral buds of wild type and meiMIGS-PPX1, meiMIGS-PPX2 and meiMIGS-PPX1-PPX2 T2 transgenic lines. The y axis indicates fold-enrichment of PPX1 and PPX2 transcripts, compared to PPX1 in wild type. DMC1 was used as a meiotic gene for normalization. Replicate measurements are shown as dots and mean values shown by horizontal lines. b, Correlation between PPX1 and PPX2 transcript levels in wild type, meiMIGS-PPX1, meiMIGS-PPX2, and meiMIGS-PPX1-PPX2 lines. The x and y axis indicate relative PPX1 and PPX2 transcript levels in meiMIGS-PPX1 (blue), meiMIGS-PPX2 (red), and meiMIGS-PPX1-PPX2 (green) lines respectively, compared to PPX1 and PPX2 expressions in wild type Col plant (r=0.80, P value=1.21×10⁻⁵).

