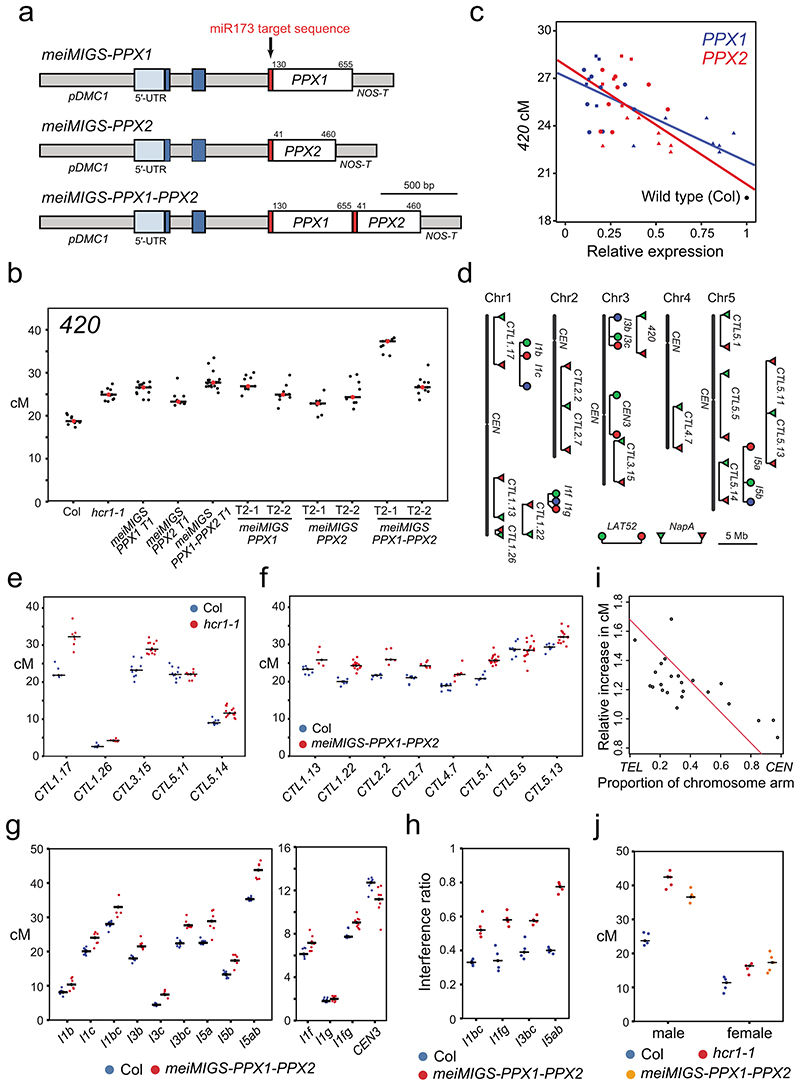
Figure 3. Euchromatic crossover frequency increases and crossover interference decreases in hcr1 and meiMIGS-PPX1-PPX2.
a, Graphical representation of the meiMIGS-PPX1, meiMIGS-PPX2 and meiMIGS-PPX1-PPX2 constructs. b, 420 crossover frequency (cM) in wild type, meiMIGS-PPX1, meiMIGS-PPX2 and meiMIGS-PPX1-PPX2 T1 and T2 transgenic lines. c, Correlation between 420 cM and PPX1/HCR1 and PPX2 transcript levels in floral buds of wild type and meiMIGS-PPX1, meiMIGS-PPX2 and meiMIGS-PPX1-PPX2 T2 transgenic lines. The y axis represents 420 cM and x axis indicates fold-enrichment of PPX1 (blue) and PPX2 (red) transcript levels compared to PPX1 and PPX2 in wild type in RT-qPCR analysis. DMC1 was used as a meiotic gene for normalization. Mean values of triple replicate RT-qPCRs were used. Wild type (Col), meiMIGS-PPX1, meiMIGS-PPX2 and meiMIGS-PPX1-PPX2 plants are shown as a black circle, red or blue-circles, -triangles and -squares, respectively. d, FTL T-DNA intervals throughout the Arabidopsis genome used to measure crossover frequency. Circles indicate LAT52-driven, and triangles indicate NapA-driven FTL transgenes. e, As for c, but showing FTL crossover frequency in wild type (blue) and hcr1-1 (red). Mean values are indicated by horizontal black lines. f, As for c, but showing FTL crossover frequency in wild type (blue) and meiMIGS-PPX1-PPX2 (red). g, As for c, but showing pollen-based FTL crossover frequency in wild type (blue) and meiMIGS-PPX1-PPX2 (red). h, Crossover interference ratio measured using FTL pollen tetrads in wild type (blue) compared with meiMIGS-PPX1-PPX2 (red). i, Correlation between FTL cM change in hcr1-1 or meiMIGS-PPX1-PPX2 and the midpoint of the FTL interval analysed relative to the telomere (TEL) and centromere (CEN). j, 420 crossover frequency (cM) in male and female meiosis of wild type (blue), hcr1-1 (red) and meiMIGS-PPX1-PPX2 (orange).

