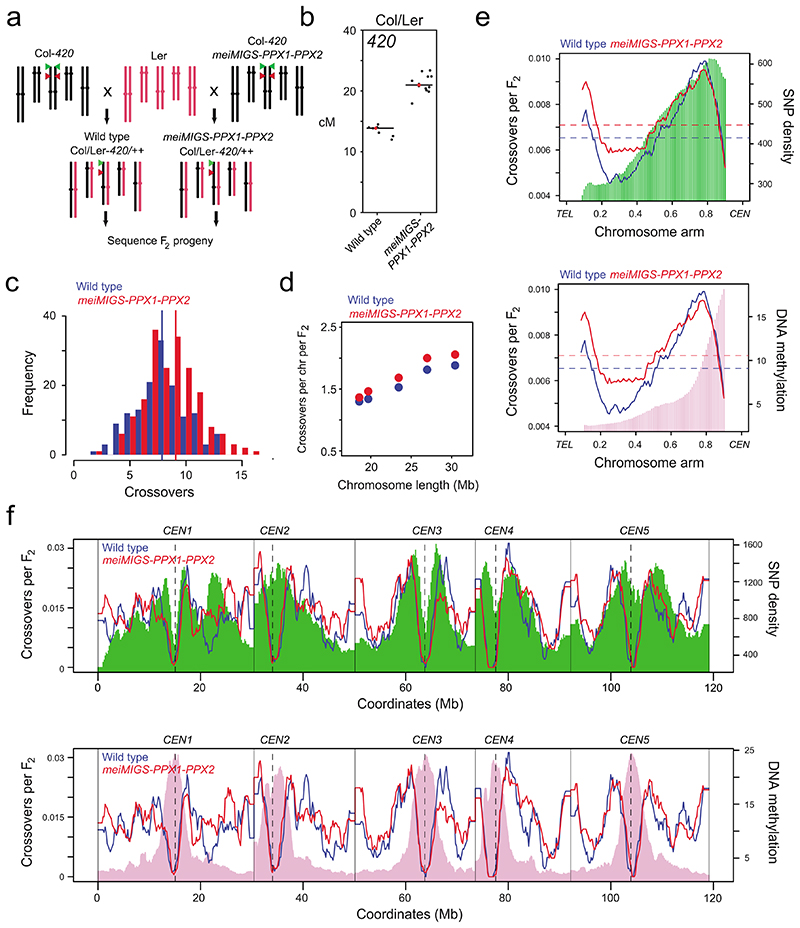
Figure 4. Genome-wide mapping of crossovers in meiMIGS-PPX1-PPX2.
a, Schematic diagram showing crossing of meiMIGS-PPX1-PPX2 Col-420 (black) and wild type Col-420 (black), to Ler (red) to generate F2 populations for genotyping-by-sequencing. Green and red triangles indicate 420 T-DNAs on chromosome 3. b, 420 crossover frequency (cM) in wild type and meiMIGS-PPX1-PPX2 Col/Ler F1 hybrids. c, Histogram of crossover number per F2 individual in wild type (blue) Col/Ler and meiMIGS-PPX1-PPX2 (red) populations. Vertical dashed lines indicate mean values. d, Crossovers per chromosome per F2 compared with chromosome length in wild type (blue) and meiMIGS-PPX1-PPX2 (red). e, Normalized crossover frequency plotted along chromosome arms orientated from telomere (TEL) to centromere (CEN) in wild type (blue) and meiMIGS-PPX1-PPX2 (red) F2 populations. Mean values are indicated by horizontal dashed lines. Also plotted is Col/Ler SNP frequency (green, upper) and DNA methylation (pink, lower). f, As for e, but without telomere-centromere scaling. Vertical solid lines indicate telomeres and vertical dotted lines indicate centromeres.

