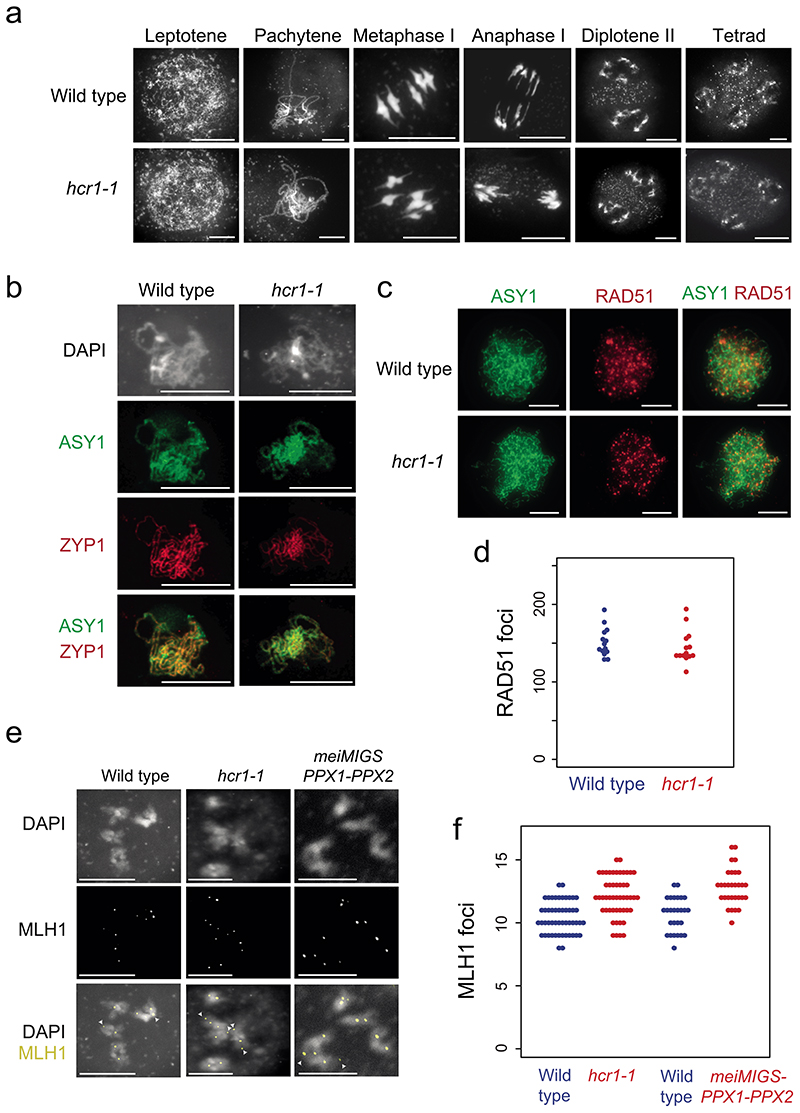
Figure 5. Meiotic MLH1 foci are elevated in hcr1 whereas RAD51, ASY1 and ZYP1 immunostaining are unchanged.
a, Representative images of male meiocytes spread and stained with DAPI in wild type (Col) and hcr1-1, at the labeled stages of meiosis. Scale bars=10 μm. b, Representative images of ASY1 (green) and ZYP1 (green) immunostaining of wild type (Col-0) and hcr1-1 male meiocytes at pachytene. Nuclei spreads were also stained with DAPI. Scale bars=10 μM. c, Representative images of ASY1 (green) and RAD51 (red) co-immunostaining on wild type (Col-0) and hcr1-1 male meiocytes during early prophase I. Scale bars=10 μM. d, Quantification of RAD51 foci number per cell in wild type and hcr1-1. e, Representative images of MLH1 (red) immunostaining of male meiocytes at diakinesis stage in wild type, hcr1-1 and meiMIGS-PPX1-PPX2. Cells were also DNA stained with DAPI (blue). Arrows represent MLH1 foci at distal locations on the chromosomes. Scale bars=10 μM. f, Quantification of MLH1 foci number per cell scored at diakinesis stage in wild type (blue), hcr1-1 (red) and meiMIGS-PPX1-PPX2 (red). Scale bars=10 μM. All cytological experiments represent data collected from at least two biological replicates.

