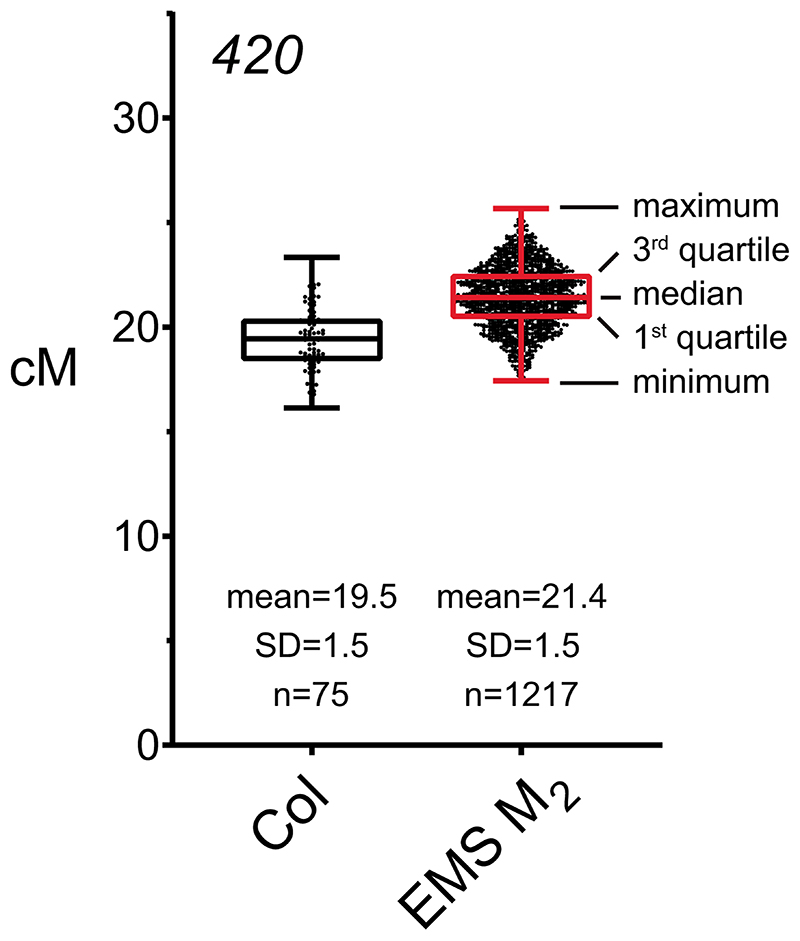
Extended Data Fig. 1. 420 crossover frequency in wild type and M2 plants derived from the EMS population.
Box and whisker plot showing 420 crossover frequency (cM) for wild type (Col/Col) 420/++ plants (n=75) and EMS-treated M2 420/++ plants (n=1,217). Black dots indicate 420 crossover frequency in individual plants. Horizontal lines of black (wild type, Col) and red (EMS M2) box plots represent maximum, 3rd quartile, median, 1st quartile and minimum in 420 cM. In this study, wild type plants show a mean value of 19.5 cM (standard deviation=1.5) within 420, and the majority (81.4%, 991/1,217) of M2 plants display 420 crossover frequency within the range of 18-22 cM (Mean=21.4 cM, SD=1.5). 420 crossover frequency in M2 plants was significantly increased compared to wild type (Welch’s t-test P=2.2×10⁻¹⁶), which may have been caused by heterozygous EMS polymorphisms.

