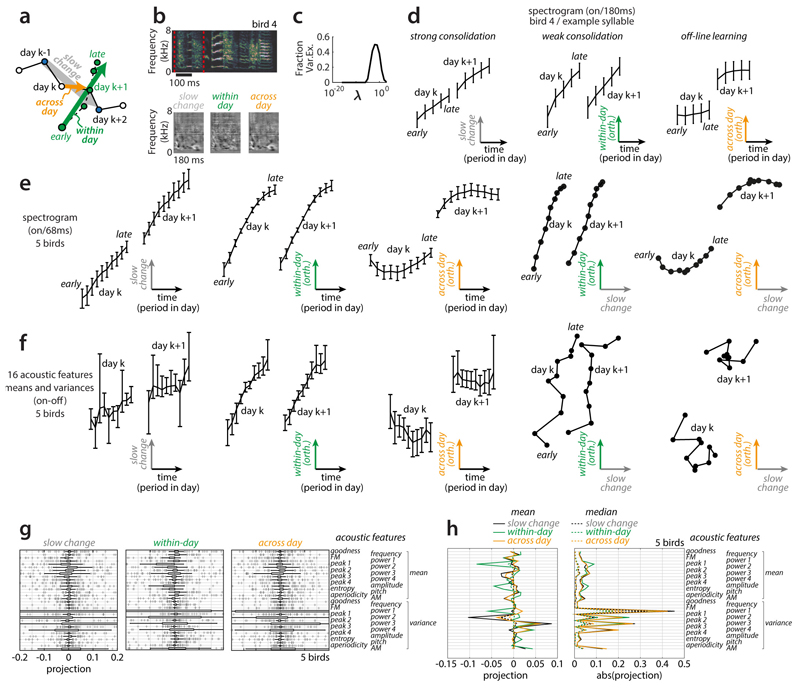
Extended Data Figure 7. Local linear analysis.
(a-e) We validated the structure of change inferred with nearest neighbor statistics (Fig. 3) with an approach based on linear regression in the high-dimensional spectrogram space (see Methods). Unlike for the case of nearestneighbor-based statics, here each rendition must first be assigned to a cluster (i.e. a syllable, compare Fig. 2a) and each cluster is analyzed separately.
(a) Illustration of the linearization scheme. First, we infer the (local) direction of slow change (DiSC) on days k and k+1 (gray arrow) as the vector of linear regression coefficients relating production day to variability of renditions from days k-1 and k+2. Second, we infer the direction of within-day change (green arrow) as the linear-regression coefficients relating the period within a day to variability of renditions from days k and k+1, orthogonalized to the DiSC. Third, we infer the direction of across-day change (orange arrow) as the linear-regression coefficients relating production day to variability of renditions from days k and k+1, orthogonalized to the DiSC and within-day change. All three sets of coefficients, and the corresponding directions in spectrogram space, typically vary across days, syllables, and birds. The progression of song along the DiSC and along the (orthogonalized) directions of within-day and across-day change are obtained by projecting renditions on day k and k+1 onto the corresponding directions.
(b) Example rendition of syllable b as in Fig. 1 (top; encapsulated by red lines) and inferred coefficients (i.e. directions in spectrogram space; bottom) for day k=57. Bright and dark shades of gray mark spectrogram bins for which power increases or decreases, respectively, over the corresponding timescales in (a).
(c) Dependency of cross-validated regression quality (fraction of variance explained) on the regularization constant for the estimation of the DiSC. One regularization constant was chosen for each syllable and direction based on maximizing the leave-one-out cross validation error on the training set.
(d) Progression of syllable b along the directions of change shown in (b), during days 57 and 58. Renditions from each day are binned into 10 consecutive periods based on production time within the day (analogous to the 10 periods in Fig. 3a,b; curves and error bars: means and 95% bootstrapped confidence intervals). For simplicity of visualization, the time elapsed (horizontal axis) during the night between days k and k+1 is not shown to scale. The position along the DiSC for the morning of day k+1 is close to that for the evening of day k, indicating overall strong consolidation (left). The position along the direction of within-day-change is reset overnight, implying that the underlying changes are not consolidated (middle). The position along the direction of across-day change jumps overnight, consistent with off-line learning (right). Notably, strong consolidation, weak consolidation, and offline learning have all been reported in the past, albeit in different behaviors and species. The panels in (d) show that these different patterns of change can occur in the very same syllable along distinct spectral features (see also Fig. 1h and Extended Data Fig. 8). By considering features with different projections onto these directions a wide range of consolidation patterns can be “uncovered” (Fig. 1h).
(e) Same as (d) but averaged across all 4-day windows during days 60-69 and over all syllables and birds (same 5 birds as in Figs. 2, 3). The resulting averages include contributions from the entire behavioral repertoire, including regressions, typical renditions, and anticipations. The two right-most panels show concurrent progression along the DiSC and the direction of within-day or across-day change, combining data from the first and second, or first and third panels in (e). These representations are analogous, and in qualitative agreement, with the behavioral trajectories in Fig. 3h-k (typical).
(f) Analogous to (e) but computed on vocalizations represented by 32 acoustic features instead of spectrograms. Directions as in (e) can be retrieved, but progression along the DiSC appears noisier, suggesting that the 32 acoustic features do not fully capture in particular the slow spectral changes occurring over development (see also Extended Data Fig. 9).
(g,h) Contribution of individual acoustic features to the directions of slow, within-day, and across-day change. As in (f), the directions are computed in the space of 32 acoustic features.
(g) Distribution of coefficients in the retrieved orthonormalized directions. Thick and thin black bars: mean and 95% confidence intervals; crosses: outliers; thin vertical lines: median.
(h) Mean (solid lines) and median (dotted lines) of the signed (left) or unsigned (right) distributions in (g). Most coefficients are small and variable, indicating that the alignment between any of the 32 acoustic features and the inferred directions of change is weak and highly variable over time, syllables, and birds.

