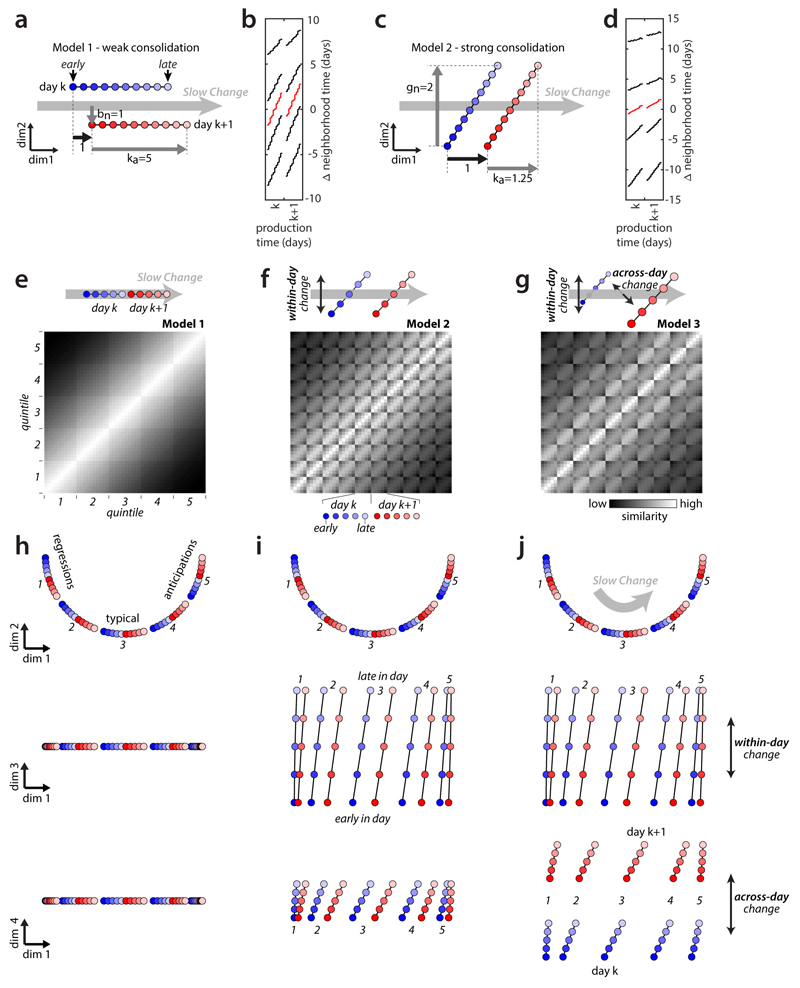
Extended Data Figure 4. Models of the alignment between components of change.
(a-d) Validation of repertoire dating. We simulated individual behavioral renditions as points in a high-dimensional space, drawn from a time-dependent probability distribution changing both within and across days (see Methods) and verified that repertoire dating can successfully recover the underlying structure of the models. The main parameters determining the relative alignment of the direction of slow change (DiSC) with the directions of within-day and across-day change are ka, the amount of within-day change along the DiSC; gn, the amount of within-day change orthogonal to the DiSC; and bn, the amount of across-day change orthogonal to the DiSC. These parameters are expressed relative to the amount of across-day change along the DiSC (thick black arrow in (a) and (b)). The two models shown imply different amounts of overnight consolidation of within-day changes along the DiSC.
(a) Schematic illustration of model 1. Within-day change is aligned with the DiSC (gn=0) and large (ka=5). The component of across-day change orthogonal to the DiSC is as large as the component of across-day change along it. In this scenario, overnight consolidation of within-day changes along the DiSC is weak for typical renditions (20% of change is consolidated, corresponding to a consolidation index of -0.8 in Fig. 1).
(b) Repertoire dating percentiles for model 1, analogous to Fig. 3b. Dating of the typical renditions (red) closely reproduces dynamics of change along the DiSC implied by (a)—within-day change along the DiSC is large (red line extends over about 5 days) and consolidation is weak (starting point on day k+1 relative to day k moves by about 20% of overall within-day range).
(c) Schematic illustration of model 2. Within-day change has a large component orthogonal to the DiSC, whereas across-day change is aligned with the DiSC. In this scenario, overnight consolidation of within-day changes along the DiSC is strong (80% of the change is consolidated; consolidation index -0.2) for typical renditions.
(d) Repertoire dating percentiles for model 2, analogous to (b). Dating of the typical renditions (red) closely reproduces dynamics of change along the DiSC implied by (c). In (b) and (d), differences between anticipations (95th percentile) and regressions (5th percentile) correctly reflect the underlying model parameters (see Methods).
(e-j) Validation of stratified behavioral trajectories. We generated 3 sets of stratified behavioral trajectories that differ with respect to the alignment of within-day and across-day change with the DiSC. We built each set of trajectories by arranging 50 points (5 strata per day, 5 production-time periods per day, on 2 consecutive days; same conventions as Fig. 3f,g) within a 4-dimensional space. We then generated simulated stratified mixing matrices (e-g, replotted from Fig. 3f) by computing pairwise distances between all points, and transforming distances into similarities. We visualize the behavioral trajectories (h-j) with the same 2-d projections as in Fig. 3h-j, with the same scale along all dimensions. In all models, overnight consolidation along the DiSC is perfect for all strata.
(e) Model 1: within-day change and across-day change occur only along the DiSC. For each stratum (i.e. each of the five 10-by-10 squares along the diagonal) similarity decreases smoothly with time, reflecting the gradual progression of the trajectory along the DiSC within and across days.
(f) Model 2: within-day change has a large component that is not aligned with the DiSC.
(g) Model 3: both within-day and across-day change have large components that are not aligned with the DiSC. The misaligned component of across-day change reduces the similarity between day k and day k+1 compared to model 2, resulting in smaller values in the 5-by-5 squares comparing points from day k and day k+1.
(h) Behavioral trajectories for model 1: the 2-d projection containing the DiSC (top) explains all the variance in the trajectories.
(i) Behavioral trajectories for model 2: similar to (h), but points from different periods during the day are displaced also along an orthogonal direction of within-day change (middle).
(j) Behavioral trajectories for model 3: similar to (i), but points from adjacent days are displaced also along an orthogonal direction of across-day change (bottom). Note that the models in (e-f) are implemented differently than the models in (a-d) (see Methods).

