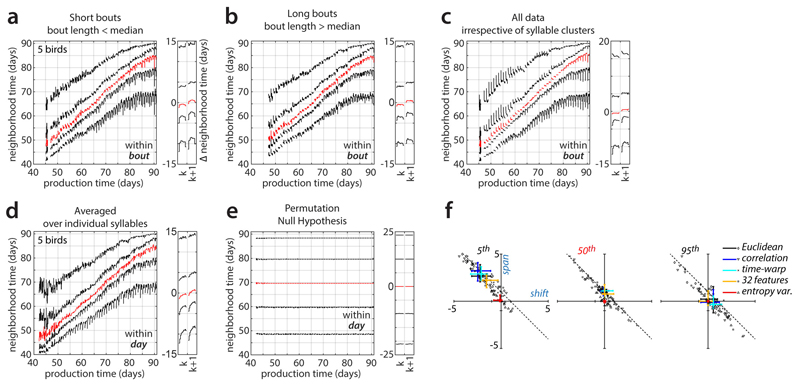
Extended Data Figure 5. Repertoire dating control analyses.
(a-c) Within-bout effects, analogous to Fig. 3c,d.
(a) Within-bout effects computed only from renditions falling into short bouts (bout length < median).
(b) Analogous to (a), but computed only from renditions falling into long bouts (bout length > median). The changes in the behavioral repertoire observed within a bout are qualitatively similar for short and long bouts (compare (a) and (b); within-bout effects are most pronounced after day 70). In particular, the song becomes more regressive shortly before the end of a bout (5th percentile, bottom curves). This finding suggests that the analogous effect in Fig. 3c,d occurs at the end of a bout rather than at a fixed time after the beginning of a bout.
(c) Analogous to Fig. 3c,d but computed over the entire data set without prior clustering into syllables. The changes in behavioral repertoire differ in several respects from those in Fig. 3c,d, which were computed on individual syllables and then averaged across syllables (see Methods). In (c), the increase in regressions at bout end is less pronounced. Moreover, large within-bout changes occur also for anticipations early during development. Both differences may reflect changes in the relative frequency of renditions from each syllable (e.g. introductory notes) sung throughout a bout. Such changes in frequency can affect the results in (c), which were computed on the un-clustered data, but not those in (a) and (b).
(d) Within-day effects, analogous to Fig. 3a,b, but computed for individual syllables, and then averaged across syllables and animals. The changes in behavioral repertoire are qualitatively similar to those in Fig. 3a,b, which were computed un the un-clustered data. This similarity implies that the dynamics along the direction of slow change in Fig. 3 cannot be explained by changes during the day in the relative frequency of renditions from each syllable.
(e) Analogous to Fig. 3a,b but computed after shuffling production times among all data points. Within-day changes of the percentile curves are small under this null hypothesis. The maximal span of within-day fluctuations is 0.2 days, compared to 3.71 for the unshuffled data in Fig. 3b. The total repertoire spread (5th – 95th percentile) is around ~40 days compared to ~23 days for unshuffled data. The 50th percentile curve is flat, implying that the shuffled data does not undergo a systematic drift over time, i.e. does not describe a direction of slow change (DiSC). The vertical separation between percentiles then reflects the range of production times in the data, not the spread along the DiSC. The time-course of the 5th and 95th repertoire dating percentiles should thus be interpreted as the progression of regressions and anticipations along the DiSC only over the range of repertoire times covered by typical renditions (i.e. approximately the vertical range of the 50th repertoire dating percentile).
(f) Analogous to Fig. 3e but for different distance metrics (Euclidean; correlation; Euclidean-after-time-warping) and feature representations (32 acoustic features; 1 acoustic feature: entropy variance). See also Extended Data Fig. 9.

