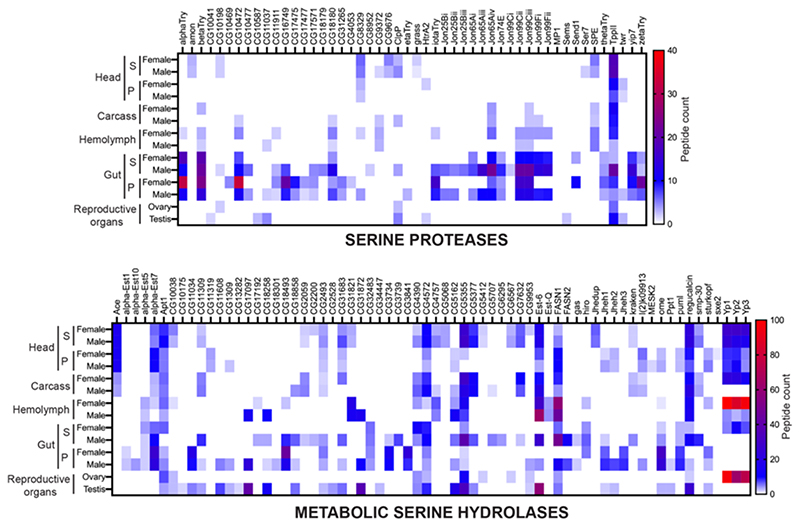
Figure 5. Determining the full complement of active SHs in adult flies.
Heat map plots for the ‘Serine Proteases’, and ‘Metabolic Serine Hydrolases’, showing SH activity signals identified from a LC-MS/MS based ABPP experiment using the SH-directed FP-biotin probe from various tissues and/or anatomical components from adult male and female flies. Data in the heat maps are represented as average peptide counts from three independent biological replicates, and peptide counts above 40 & 100 for the serine proteases and metabolic SHs respectively are colored red. For the head and gut analysis, S = supernatant proteomic fraction, P = pellet proteomic fraction.

