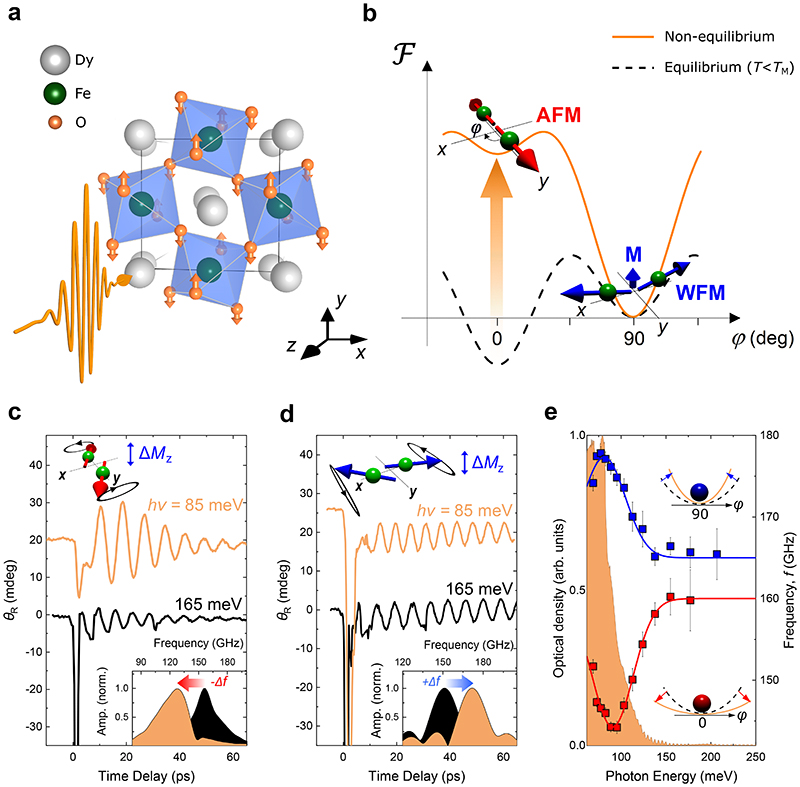
Fig. 1. Phonon-driven reconfiguration of the magnetic potential in DyFeO3.
(a) The eigenmode of the laser-excited Bu phonon mode; orange arrows indicate the atomic motion of the oxygen ions. (b) The magnetic potential Ƒ as a function of the angle φ the spins form with the y-axis before (dashed black) and after (solid orange) phonon excitation. For simplicity the potential is shown only for T<T M. The red and blue arrows depict the spin configurations corresponding to the antiferromagnetic (AFM) and weakly ferromagnetic (WFM) magnetic phases. The orange arrow highlights the destabilization of the AFM ground state together with the reduction of the potential barrier separating the phases. (c,d) Time-resolved transient rotation of the probe polarization plane θ R after light excitation with photon energy of 85 meV (orange traces) and 165 meV (black traces) performed in the AFM (b) and WFM (c) phases. The bottom insets show the normalized amplitude spectra of the soft mode oscillations. The top insets are schematics of the corresponding spin precessions, with the resulting oscillating magnetic component ΔM z. (e) Central frequency of the excited soft mode as a function of the photon energy of the pump pulse in the two magnetic phases. The solid lines serve as a guide to the eye. The background, shaded, curve shows the sample’s optical density. The insets schematically indicate changes in the local curvature of the magnetic potential.

