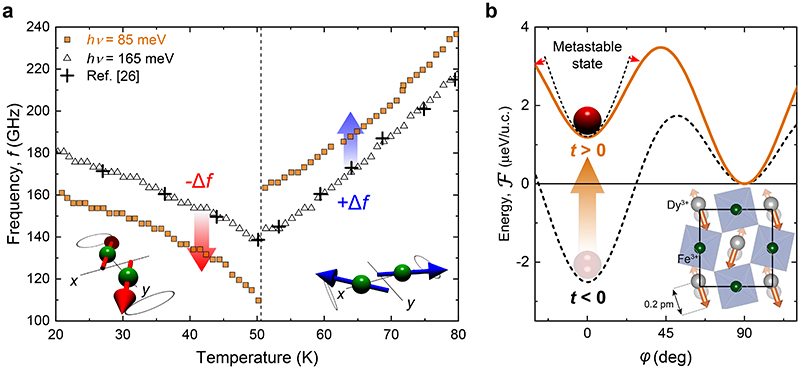
Fig. 3. Out-of-equilibrium metastable magnetic state.
(a) Frequency of the spin precession as a function of the temperature across the Morin phase transition for different photon energies of the pump excitation. (b) Reconstructed magnetic potential Ƒ before (t < 0) (dashed black) and after (t > 0) (solid orange) the phonon-pumping. The position of the red ball represents the energy state of the system. Inset: The eigenmode of the Ag lattice distortion being considered as a driving force for the dynamics of the magnetic potential. The orange arrows depict the motions of the Dy3+ ions, antipolar in the adjacent layers.

