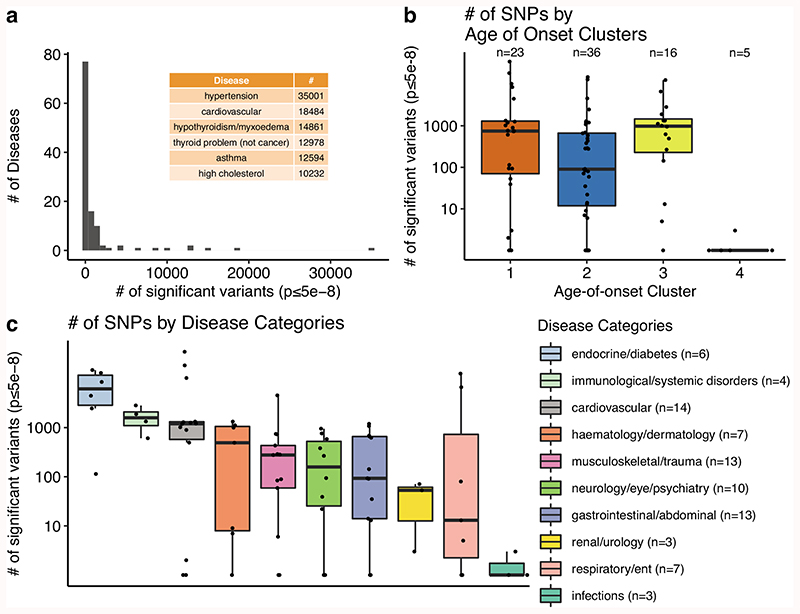
Extended Data Fig. 3. The number of significant variants across diseases, age-of-onset clusters, and disease categories.
a) Number of diseases for different number of significant variants (pBOLT-LMM≤5e-8). Diseases with the highest number of associations (N≥10,000) are given as an inset table. b) Comparison of the number of significant associations (y-axis, on a log scale) across age-of-onset clusters (x-axis) (ANOVA after excluding cluster 4, p = 0.06). Since the y-axis is on a log scale, diseases with zero significant associations are not shown on the graph. c) The same as b) but for disease categories. Categories are ordered by the median number of significant SNPs. The boxplots (b-c) show the first and third quartiles, the median (dark line), and the whiskers extend from the quartiles to the last point in 1.5xIQR distance to the quartiles.

