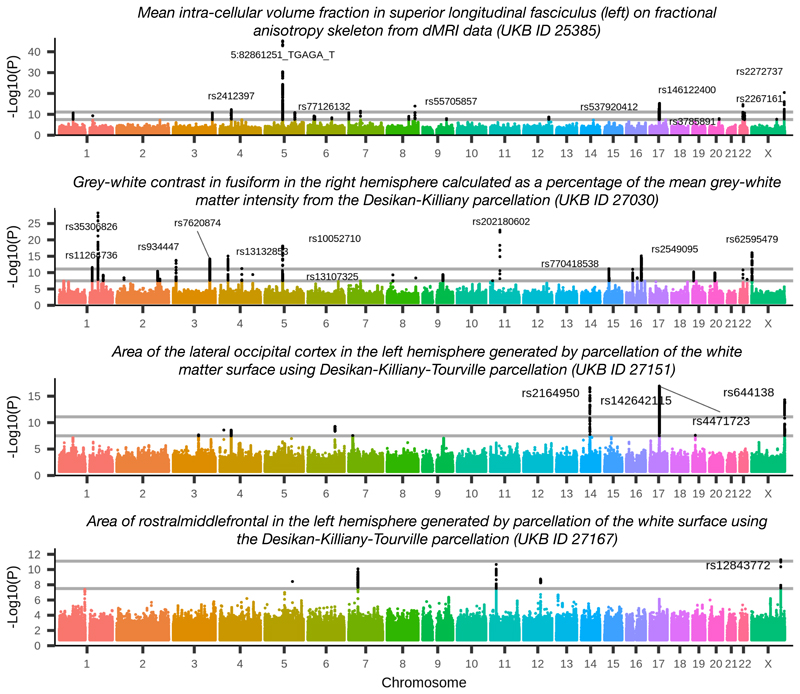
Figure 1.
Manhattan plots for the four phenotypes achieving Bonferroni corrected significance on the X chromosome. Genetic variants are labelled for peak associations achieving the Bonferroni level. Plot titles indicate phenotype definition (including UKB ID field index from http://biobank.ctsu.ox.ac.uk/crystal/field.cgi?id=25385, 27030, 27151 or 27167). Black dots indicate associations that are significant associations at the genome-wide level, −Log10(P) ≥ 7.5. Grey lines show genome-wide+Bonferroni level (11.1) and genome-wide significance level (7.5). These associations involve diffusion MRI and the Desikan-Killiany and the Dessikan-Killiany-Tourville parcellations of white matter and grey matter.

