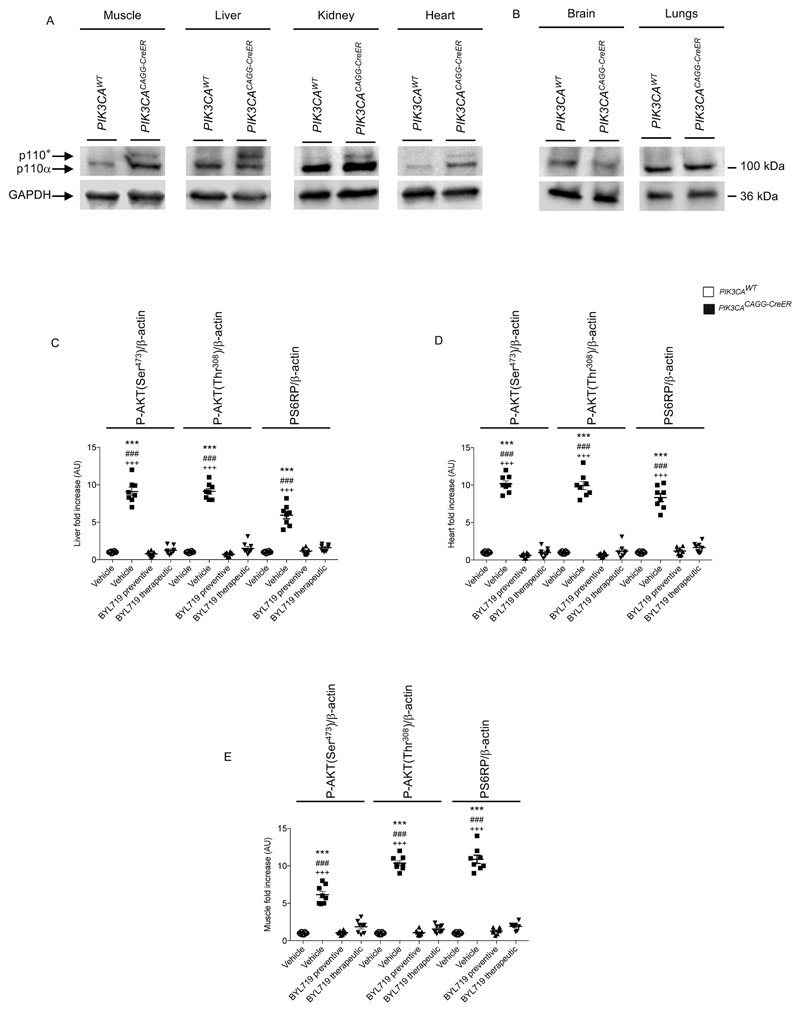
Extended Data Fig. 5. p110* expression in affected tissues.
a, Western blot showing the expression of p110* in PIK3CACAGG-CreER mice (n = 8 mice per group). b, p110* is not expressed in the brain or lungs (n = 8 mice per group). c–e, Western blot quantification of Fig. 1d, in the liver (c), heart (d) and muscle (e) of PIK3CAWT and PIK3CACAGG-CreER mice treated with or without BYL719 (n = 8 mice per group). All data are shown as mean ± s.e.m. ANOVA followed by Tukey–Kramer test (two-tailed).PIK3CACAGG-CreER versus PIK3CAWT mice, ***P < 0.001. PIK3CACAGG-CreER mice treated with vehicle versus PIK3CACAGG-CreER mice treated with preventive BYL719, ### P < 0.001. PIK3CACAGG-CreER mice treated with vehicle versusd PIK3CACAGG-CreER mice treated with therapeutic BYL719, +++ P < 0.001.

