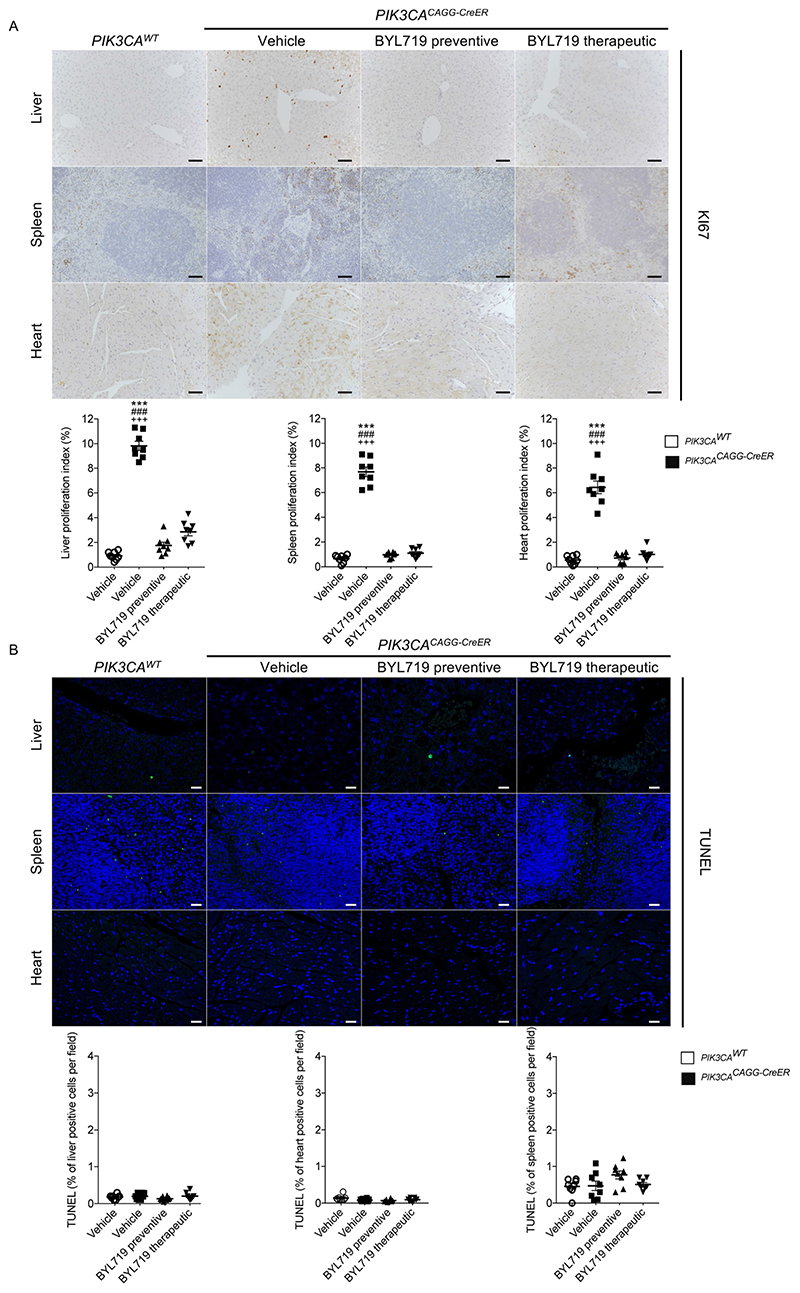
Extended Data Fig. 3. BYL719 affects proliferation.
a, Ki67 immunostaining and quantification in liver, spleen and heart of PIK3CAWT and PIK3CACAGG-CreER mice with or without BYL719 treatment (n = 8 mice per group, 10 randomly selected fields per mice, ×400). b, TUNEL assay. The graphs show the quantification of TUNEL-positive cells per field (n = 8 mice per group, 10 randomly selected fields per mice, ×400). Scale bars, 10 μm. All data are shown as mean ± s.e.m. ANOVA followed by Tukey–Kramer test (two-tailed). PIK3CACAGG-CreER versus PIK3CAWT mice, ***P < 0.001. PIK3CACAGG-CreER mice treated with vehicle versus PIK3CACAGG-CreER mice treated with preventive BYL719, ###P < 0.001. PIK3CACAGG-CreER mice treated with vehicle versus PIK3CACAGG-CreER mice treated with therapeutic BYL719, +++P < 0.001.

