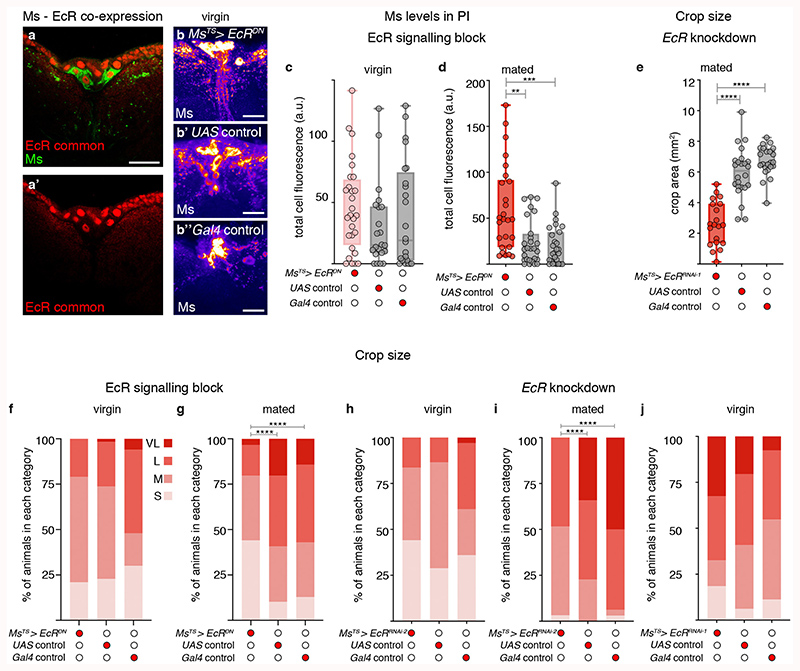
Extended Data Fig. 7. Ecdysone modulation of Ms neurons and crop size.
a-a’, Expression of EcR in PI Ms neurons. Ms staining (in green) (a) and EcR staining (in red) (a’) overlap and are shown as single channels for clarity. b-d, Ecdysone effect on Ms levels in PI neurons. Representative images show comparable Ms levels upon expression of EcRDN in virgin females (b) relative to UAS (b’) and Gal4 (b″) controls. Fluorescence signals are pseudo-coloured; high to low intensity is displayed as warm (yellow) to cold (blue) colours. c, Quantification of Ms staining intensities in PI neurons of virgin females upon expression of EcRDN showed comparable levels to UAS and Gal4 controls. d, Quantification of Ms staining intensities in PI neurons of mated females upon expression of EcRDN showed increased Ms levels relative to UAS and Gal4 controls. e, Quantification of crop area in starved-refed mated females revealed smaller crops upon adult- and Ms neuron-specific EcR downregulation compared to UAS and Gal4 controls. f-j, Classification of crop size upon expression of EcRDN (f-g) or EcR downregulation (h-j) in starved-refed female flies. Distribution of crop sizes did not significantly change relative to UAS and Gal4 controls in virgin females (f, h, j). In mated females, the distribution shifted towards smaller crop sizes, relative to UAS and Gal4 controls (g, i). Ranked data are displayed as percentages. Scale bars = 20μm. See Supplementary Information for a list of full genotypes, sample sizes and conditions. In all boxplots, line: median; box: 75th-25th percentiles; whiskers: minimum and maximum. All data points are shown. *: 0.05>p>0.01; **: 0.01>p>0.001; ***: p<0.001.

