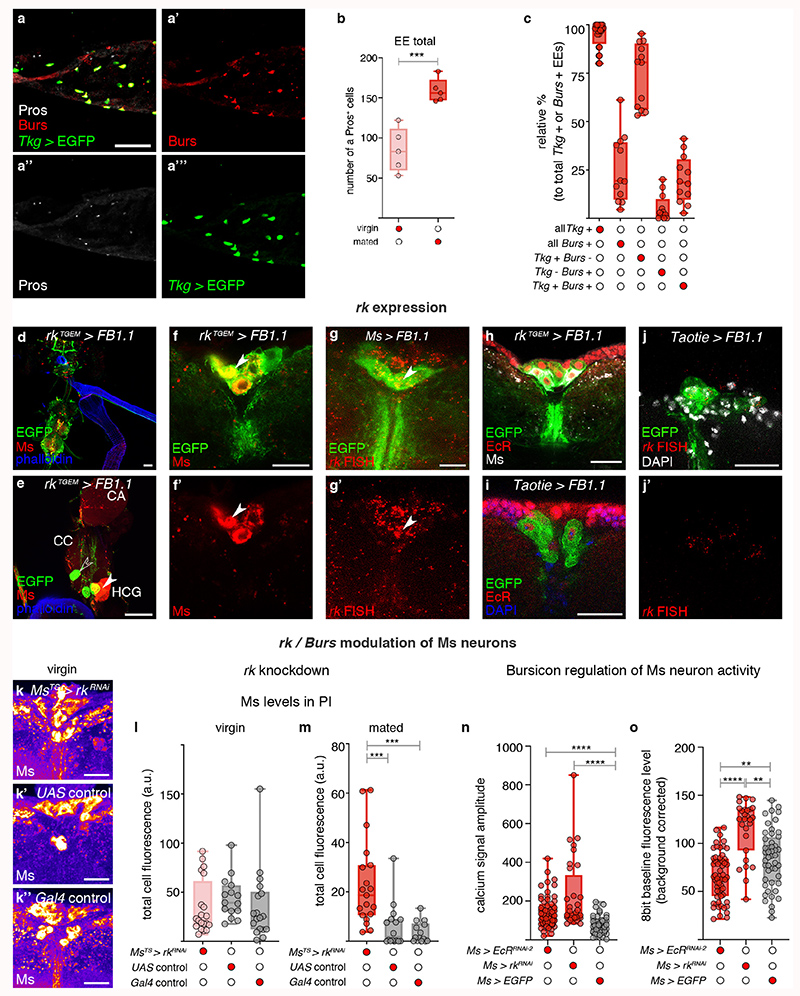
Extended Data Fig. 8. Bursicon modulation of Ms neurons.
a, Co-expression of Burs (a’, in red), Pros (a″, in white) and GFP driven by Tkg-Gal4 (a‴, in green) in midgut enteroendocrine cells of mated females. b, Quantifications of Pros-positive midgut cells shows increased enteroendocrine cell number in mated females relative to virgins. Flies were starved for 22h to increase Burs staining in the enteroendocrine cell bodies35. Single channels for each marker are shown for clarity. c, Quantification of enteroendocrine cells of mated females labelled by Tkg-Gal4-driven EGFP and Burs staining (such as that shown in a). More Tkg-Gal4-positive than Burs-positive enteroendocrine cells are apparent. The majority of Burs-positive enteroendocrine cells are Tkg-Gal4-positive. d-e, Co-expression of rkTGEM (driving FB1.1, in green) with Ms peptide (in red) is shown in brain and VNC neurons (d), and in the HCG ganglion (e). f-f’, Co-expression of rkTGEM (driving FB1.1-derived EGFP, in green) with Ms peptide (in red) was observed brain PI neurons. f’, Ms staining is shown as a single channel for clarity. g-g’, Co-expression of Ms-Gal4 (driving FB1.1-derived EGFP, in green) with rk mRNA (stained with fluorescence in situ hybridisation, in red) was observed in brain PI neurons. g’, rk fluorescence in situ hybridisation signal is shown as a single channel for clarity. h, Co-expression of rkTGEM (driving FB1.1-derived EGFP, in green) with Ms peptide (in white) and EcR (in red) was observed in brain PI neurons. i, Co-expression of Taotie-Gal4 (driving FB1.1-derived EGFP, in green) with EcR (in red) was observed in brain PI neurons. Nuclei are stained with DAPI (in blue). j-j’, Co-expression of Taotie-Gal4 (driving FB1.1-derived EGFP, in green) with rk mRNA (stained with fluorescence in situ hybridisation, in red) was observed in brain PI neurons. Nuclei are stained with DAPI (in white). j’, rk mRNA fluorescence in situ hybridisation signal is shown as a single channel for clarity. k-m, rk regulation of Ms levels in PI neurons. Representative images show similar Ms staining signal upon adult-specific rk downregulation in virgin females (k) relative to UAS (k’) and Gal4 (k″) controls. Fluorescence signals are pseudo-coloured; high to low intensity is displayed as warm (yellow) to cold (blue) colours. l, Quantification of Ms staining intensities in PI neurons of virgin females upon adult-specific rk downregulation showed comparable levels to UAS and Gal4 controls. m, Quantification of Ms staining intensities in PI neurons of mated females upon adult-specific rk downregulation showed increased Ms levels relative to UAS and Gal4 controls. n, Quantification of the amplitude of GCaMP oscillations in PI neurons of mated females shows that downregulation of EcR and rk in Ms neurons significantly increased the amplitude of calcium signal. o, Quantification of GCaMP baseline fluorescence levels in PI neurons of mated females revealed that downregulation of EcR in Ms neurons significantly reduced GCaMP signal, whereas downregulation of rk increased GCaMP signal, both relative to expression of EGFP. Hence, calcium oscillations become virgin-like both upon EcR or rk downregulation, whereas their effects on overall calcium fluorescence are different. Scale bars = 20μm apart from a-a″ and d-e = 50μm. See Supplementary Information for a list of full genotypes, sample sizes and conditions. In all boxplots, line: median; box: 75th-25th percentiles; whiskers: minimum and maximum. All data points are shown. *: 0.05>p>0.01; **: 0.01>p>0.001; ***: p<0.001.

