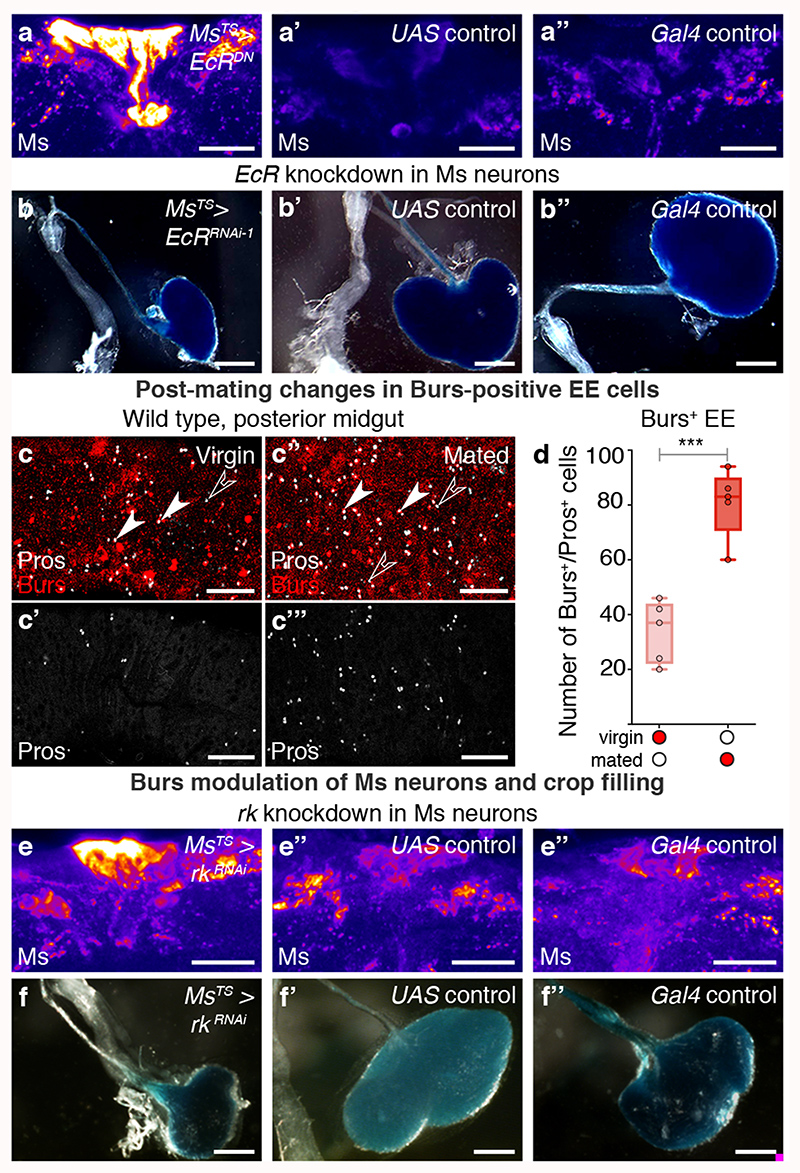
Fig. 3. Steroid and enteroendocrine modulation of Ms neurons and crop enlargement.
a-b″, Representative Ms levels (a-a″) and crops (b-b″) following adult-specific, Ms-Gal4-driven expression of EcRDN in mated females. Higher Ms levels in PI Ms neuron cell bodies (a) and smaller crops (b) are apparent relative to controls (a’,a″,b’,b″). c’-c‴, Increased expression of enteroendocrine cell marker Prospero (Pros, in white) and Burs (in red) in the midguts of mated (c″,c‴) vs virgin (c,c’) female flies. Filled arrow heads = Pros and Burs-positive cells; empty arrowheads = Pros-positive/Burs-negative cells. c,c″ are full z projections; c’,c‴ are single z slices. d, More Burs-expressing, Pros-positive enteroendocrine cells are apparent in mated females compared to virgin females. e-f″, Representative Ms levels (e-e″) and crops (f-f″) following adult-specific, Ms-Gal4-driven rk downregulation in mated females. Higher Ms levels in PI Ms neuron cell bodies (e) and smaller crops (f) are apparent relative to controls (e’,e″,f’,f″). Scale bars: a-a″, e-e″ = 20μm, c-c‴ = 50μm and b-b″, f-f″ = 500μm. Statistics: Mann-Whitney-Wilcoxon test.

