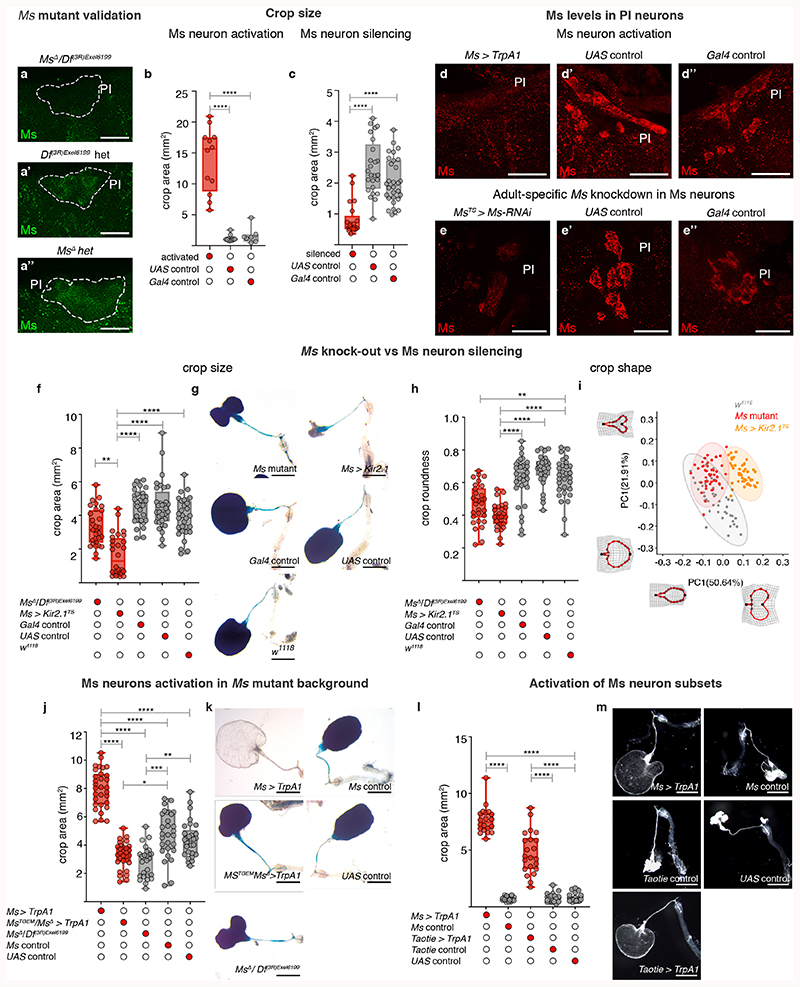
Extended Data Fig. 4. Ms neuron regulation of crop enlargement.
a-a’, Validation of MsΔ mutant using anti-Ms staining shown in green; PI is highlighted by dashed lines. a, Lack of Ms staining in the PI of Ms mutants (MsΔ/ Df(3R)Exel6199). Ms staining is apparent in the PI of Df(3R)Exel6199 (a’) and MsΔ (a″) heterozygous control flies. b, Quantifications of crop area in ad libitum-fed flies upon Ms-Gal4-driven TrpA1 expression (4h at the permissive temperature), showing these have significantly larger crops relative to UAS and Gal4 controls. c, Quantifications of crop area in starved-refed flies upon Ms-Gal4-driven Kir2.1 expression (temporally confined with tub-Gal80TS), showing these have significantly smaller crops relative to UAS and Gal4 controls. d-e″, Effect of neuronal activation and Ms downregulation on Ms levels in PI neurons. Thermogenic activation of Ms neurons in ad libitum fed flies depletes Ms peptide (in red) from Ms neuron cell bodies in the PI (d) compared to UAS (d’) and Gal4 (d″) controls. Adult-specific Ms downregulation in Ms neurons of starved-refed flies results in reduced Ms staining (red) in PI neurons (e), compared to UAS (e’) and Gal4 (e″) controls. f-i, Effect of Ms loss-of-function and adult-specific Ms neuron inactivation on crop expansion and shape, upon starvation-refeeding in mated females. f, Quantifications of crop area revealed that Ms neuron inactivation results in smaller crops relative to Ms mutant or w1118, UAS and Gal4 controls. g, Representative crop images of genoytpes quantified in f. h, Quantifications of crop roundness revealed that crops are less round upon Ms neuron inactivation or in Ms mutant compared to w1118, UAS and Gal4 controls. i, PCA of landmark position variation along the crop outline, showing that crop shapes are distinct between Ms mutant (red), Ms neuron inactivation (yellow) and w1118 (grey), being more similar between Ms mutant and w 1118, as highlighted by partial overlap of their 95% confidence ellipses. Wireframe deformation grids are shown to illustrate the mininum and maximum shape deviations as compared to the mean shape along each PC axis. j-k, Effect of Ms neuron activation on crop expansion in Ms mutant background, upon starvation-refeeding in mated females. j, Quantifications of crop area show that activation of Ms neurons by Ms-Gal4-driven TrpA1 expression resulted in larger crops relative to activation of Ms neurons by MsTGEM-driven TrpA1 expression in an heteroallelic mutant background, as well as relative to Ms mutant or UAS and Gal4 controls. k, Representative crop images of genoytpes quantified in j. l-m, Effect of Ms and Taotie neuron activation on crop enlargement, upon starvation in mated females. l, Quantification of crop area shows that activation of either Ms neurons or Taotie neurons resulted in larger crops compared to respective Gal4 controls and UAS control, even in the absence of food. m, Representative crop images of genotypes quantified in l. Scale bars: a-a’ = 10μm, d-e″= 25μm, g, k and m = 500μm. See Supplementary Information for a list of full genotypes, sample sizes and conditions. In all boxplots, line: median; box: 75th-25th percentiles; whiskers: minimum and maximum. All data points are shown. *: 0.05>p>0.01; **: 0.01>p>0.001; ***: p<0.001.

