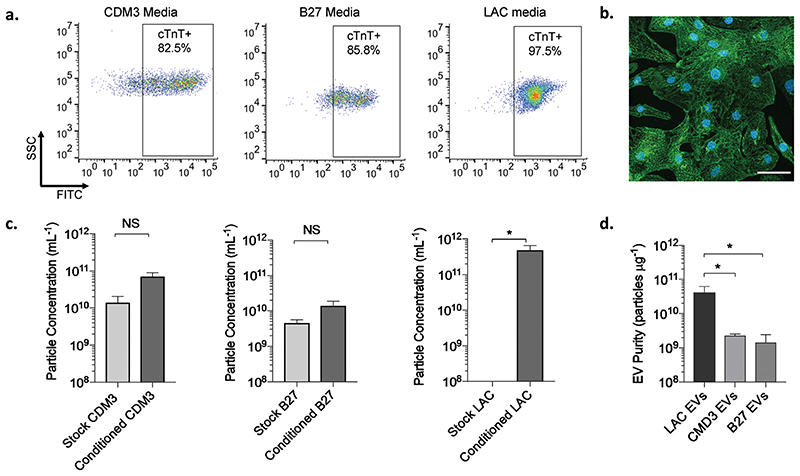
Fig. 2.
CM differentiation capacity and purity of isolated EVs in different media conditions. (a) Representative dot plots of side scatter (SSC) versus FITC fluorescence intensity of cardiac troponin T positive (cTnT+) cells after differentiation under different media conditions: CDM3 media (left), B27 media (middle) and LAC media (right). (b) A representative image of immunostaining for sarcomeric α-actinin (green) shows highly enriched population of human CMs obtained after culturing in glucose-depleted media supplemented with lactate (LAC media). Nuclei were counterstained with DAPI (blue). Scale bar, 50 μm. (c) Particle concentration (mean + s.e.m.; N = 3–7; unpaired Welch’s t-test) for stock and conditioned media from CDM3 media (left), B27 media (middle) and LAC media (right). (d) Purity comparison for EVs (mean + s.d.; N = 3–7; one-way ANOVA) purified from the different types of cell culture media based on the particle to protein ratio. * p < 0.05; NS: non-significant; N: independent replicates.

